
-
Publish Your Research/Review Articles in our High Quality Journal for just USD $99*+Taxes( *T&C Apply)
Offer Ends On
Publish Your Research/Review Articles in our High Quality Journal for just USD $99*+Taxes( *T&C Apply)
Offer Ends On
Shary Peter A*, Sharaya Larisa S and Rukhovich Olga V
Corresponding Author: Peter A. Shary, Institute of Physicochemical and Biological Problems in Soil Science RAS, 142290, Pushchino, Russian Federation.
Received: September 05, 2025 ; Revised: September 26, 2025 ; Accepted: November 21, 2025 ; Available Online: December 05, 2025
Citation: Shary Peter A, Sharaya Larisa S & Rukhovich Olga V. (2025) Spring Barley as Influenced by Climate and Topography in the Urals, Russia. J Agric For Meterol Stud, 4(1): 1-8.
Copyrights: ©2025 Shary Peter A, Sharaya Larisa S & Rukhovich Olga V. This is an open-access article distributed under the terms of the Creative Commons Attribution License, which permits unrestricted use, distribution, and reproduction in any medium, provided the original author and source are credited.
Views & Citations
Likes & Shares
In the Ural Federal Area (UFA), 70 administrative districts where barley is grown vary significantly in land surface elevation Z, ranging from 50 to 528 m. At the same time, air temperature, precipitation, and soil moisture depend on Z, which is why the yield of rain-fed spring barley is related to altitude, so that for all districts located at Z greater than 300 m, the yield is lower than average. It has been established that in UFA, the daytime temperature in July increases with increasing Z, and the nighttime temperature decreases. At the same time, in the summer, these temperatures in UFA are not correlated, which facilitates the construction of a multiple regression model. Using this model, it is shown that the yield of barley in UFA decreases by 38% (0.6 t/ha) with an increase in the July night temperature by 1°C and by 22% (0.35 t/ha) with an upward rise for every 100 m. With a slight 10 mm increase in July precipitation relative to the climatic norm, the yield of spring barley increases by 8% (0.12 t/ha), but with a strong change, the response is non-linear, so that the yield of barley can decrease both with a decrease in summer precipitation (drought) and with an increase (waterlogging). The established dependences of climatic factors and yields on altitude can be used in UFA to select promising areas of barley cultivation.
INTRODUCTION
With an average global barley yield of ≈2.7 t/ha, in less favorable climatic conditions in Russia it is lower, ≈1.8 t/ha, although due to the large areas of cultivation, Russia is the world leader in gross harvest of barley grain [1]. In regions of Russia with a sharply continental climate, yields are even lower, for example, 0.76 t/ha in the Republic of Tuva on average for 2013-2015 [2]. The Ural Federal Area (UFA), which is being studied here, also belongs to regions with a continental climate. The UFA includes four regions: Chelyabinsk, Kurgan, Tyumen and Sverdlovsk. In the UFA region, spring barley is cultivated, and winter barley is almost not used. It is noted that the yield potential of spring barley declared by breeders is far from being fully realized in production conditions, for example, by 30-40% in the Chelyabinsk region [3].
Daytime (Tmax) and nighttime (Tmin) air temperatures have different effects on crop yields [4]. If Tmax is associated with carbon assimilation during photosynthesis, then Tmin is associated with carbon loss during nocturnal respiration of plants. The negative effect of increasing Tmin on the yield of irrigated rice was shown in Philippines and estimated over 12 years of experiment (1992-2003) as a 10% decrease in yield with 1°C increase in Tmin during the growing season [5]. For 15 years (1987-2001), Tmin decreased locally in northwestern Mexico, and this led to an increase in the yield of irrigated durum wheat by 28.6 kg/ha per year (~10% per 1°C), while in the rest of Mexico its yield increased by only 1.1 kg/ha per year [6]. Therefore, the effects of Tmax and Tmin on yield should be distinguished.
In many regions of the world, night and daytime temperatures are closely related, which prevents their simultaneous use in multiple regression models [7]. However, this is not the case everywhere in Russia. In particular, the relationship between them is insignificant in July in UFA, and significant (r> 0.7) in the winter months, as well as in March and November [8].
In breeding experiments for the j-th year (or site), according to the method of Eberhart and Russell [9], an environmental index Ij is compiled, defined by yields as Ij = Yj – Yav, where Yj is the yield of the j-th year (averaged over varieties), and Yav is the average (over the years and varieties) yield. It is clear that the Ij index is negative for unfavorable conditions of the year, when the yield of the year Yj is less than the average Yav, and positive when it is more.
Next, the regression equation Yij = Yi + biIj is compiled and it is assumed that the slope coefficient bi characterizes the stability of i-th cultivar, and part of the variance for i-th cultivar is another measure of its stability. These authors noted that an environmental index is desirable, independent of varieties and determined by environmental factors such as precipitation, temperature, and soil fertility, but that such an index is not yet available [9]. It is clear that the Ij index in their definition does not provide information about specific environmental factors, and therefore the study of patterns of yield dependence on environmental factors remains relevant. The environmental index Ij itself may depend on environmental factors, since it is expressed in terms of yields, and they depend on these factors.
When using topography and districts instead of years, it turns out that climatic parameters and soil characteristics (e.g., moisture) also depend on topography, for example, on altitude of the district. That is, the environmental index Ij can be related to altitude. Therefore, we include topography in the consideration. Until now, topography in the Urals has been used to refine the soil map [10], assess the content of organic carbon in soils [11], and identify agro-ecological land types [12].
The purpose of the work is to study the influence of climate and topography on the yield of rain-fed spring barley in UFA.
KEYWORDS: spring barley; climate; land surface elevation; environmental index; multiple regression
MATERIALS AND METHODS
Data on the average yield of non-irrigated spring barley for 12 years (2011-2022) were taken from municipal reports for 70 districts of the Ural Federal Area (UFA). We have averaged these data over these 12 years. The monthly average values of daytime (Tmax), nighttime (Tmin), and average daily (Tmean) temperatures, as well as precipitation (P), are taken from the World Clim database [13], where they are averaged over 50 years (1950-2000) and presented with a resolution of 1 km. We also averaged them for each district. The environmental index Ij (j numbers the districts) is calculated as Yj – Yav, where Yav is the average yield of spring barley by districts and by years; thus, negative Ij characterize districts with yields below the average Yav, and positive ones – above. We also used the diurnal temperature range (DTR) of each month, since in the UFA, yields of barley, wheat and oats were closely related to DTR values during growing season [8].
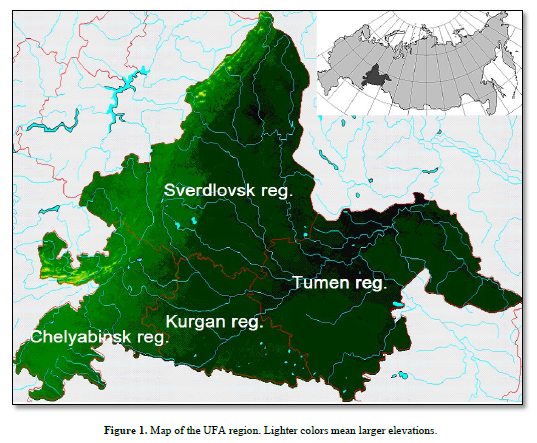
Digital Elevation Model (DEM) is taken from the SRTM30 database [14], where it has a resolution of 1 km. The used topographic attributes and methods of their calculation are described in [15]. Their calculation, as well as the calculation of the equations of multiple regression, was carried out using the software “Analytical GIS Eco” [16], version 1.08r. The DEM of the UFA region is shown in Figure 1.

To select the leading environmental factors (predictors) in the multiple regression model, we went through all combinations of four linearly independent predictors (the fifth is usually insignificant in the model), selecting the four for which coefficient of determination R2 was the largest. The independence of the predictors was determined by the criterion of [17]. Any four linearly dependent predictors were excluded from consideration. Thus, the choice of predictors did not depend on the preferences of the authors.
Student’s t-statistics were used to assess the contribution of predictors: the relative contribution of i-th predictor (in percent) was estimated using the formula 100|ti|/S|ti|. The predictors in the model below are arranged in descending order of their contribution (the first is the main predictor).
RESULTS AND DISCUSSION
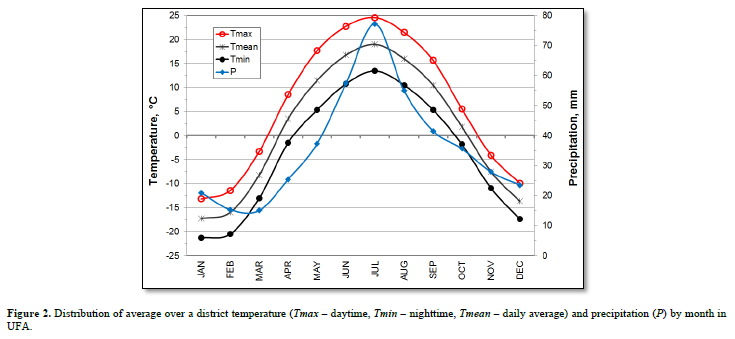
The distribution of temperatures and precipitation per year is shown in Figure 2.

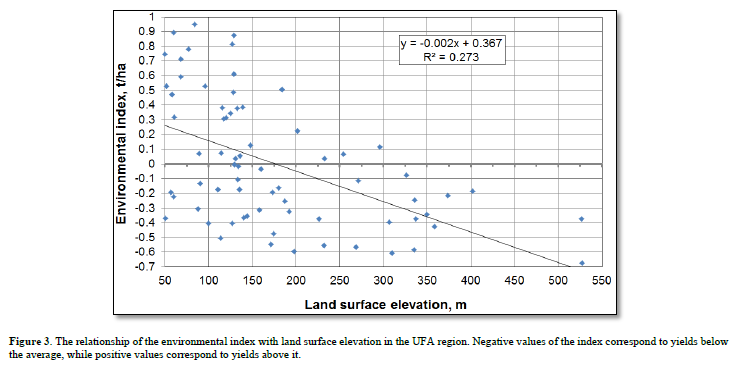
This shows that the highest average temperatures and precipitation in 70 districts of UFA are observed in July, when they can significantly affect the yield of spring barley. On the other hand, the environmental index Ij, and hence the yield, depends on land surface elevation of districts, Figure 3.

This relationship is significant (r = –0.523, p< 10–5). It can be seen from Figure 3 that for all areas located at an altitude of more than 300 m, the yield is below average. Naturally, the decrease in yield with increasing altitude is explained by changes in certain climatic factors with altitude, Figure 4.
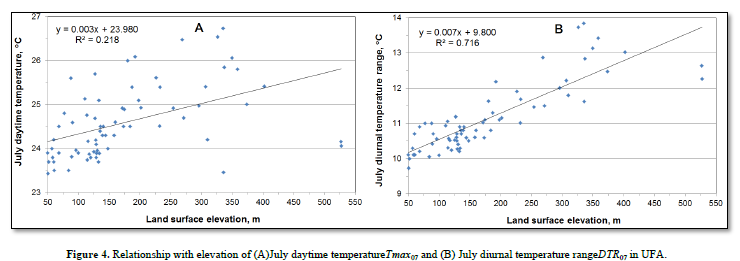
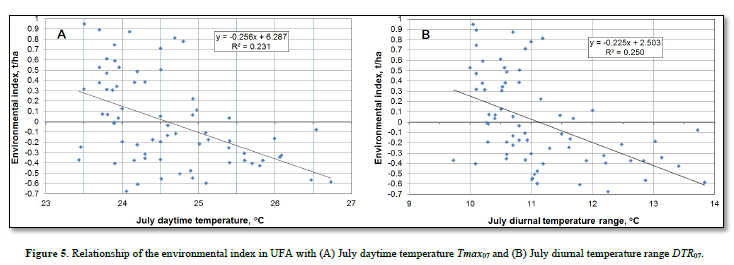
Both Tmax07 and DTR07 in the UFA region increase with increasing altitude, and the diurnal temperature range DTR07 is especially closely related to altitude (r = 0.846, p< 10–6). However, this orographic information still does not say anything about the relationship of these indicators with yield, for this we need to have a look at the relationship of the environmental index with them, Figure 5.

From this it can be seen that yields decrease with the growth of both Tmax07 and DTR07. Since both of these indicators grow in relatively high-altitude districts (Figure 4), the yield in UFA decreases with an increase in the elevation of the fields (fig. 3). Note that the yield is more closely related to DTR07 (r = –0.500, p< 10–4) than to Tmax07 (r = –0.480, p< 10–4).
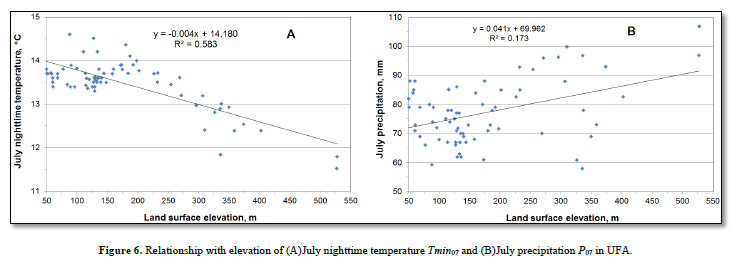
Altitude in UFA is a multidimensional environmental factor, which is associated not only with Tmax and DTR, but also with Tmin and precipitation, Figure 6.
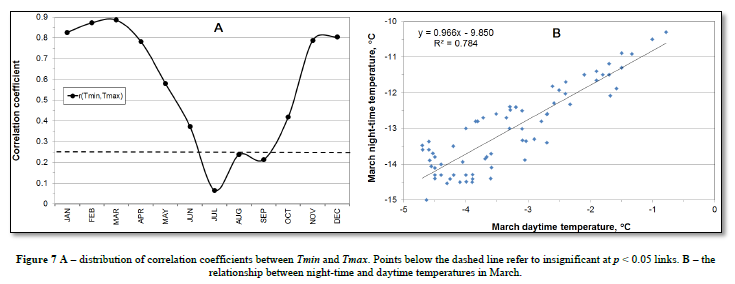
The night temperature Tmin07 decreases with elevation, and precipitation P07 increases, which is a common orographic pattern for many localities. However, it should be noted that if Tmax07 increases by 0.3 °C with an upward rise of 100 m (Figure 4A), then Tmin07 decreases with the same rise by 0.4 °C; as a result, DTR07 increases by 0.7 °C (Figure 4B). The fact that it is warmer in highlands of the UFA region during the daytime seems somewhat strange, however, this applies only to the period July-September, when Tmin and Tmax in UFA region do not correlate, Figure 7A.

In winter, as well as in March and November, Tmin and Tmax are closely related in UFA. Figure 7B shows this for March. Thus, the idea of the work [7] noted in Introduction about the close relationship between day and night temperatures in many regions of the world does not apply in UFA to the July-September period, but is valid here for winter, early spring and late autumn. Therefore, a weak or insignificant relationship between Tmin and Tmax during the growing season (with some exception for May) does not prevent the use of a multiple regression model.
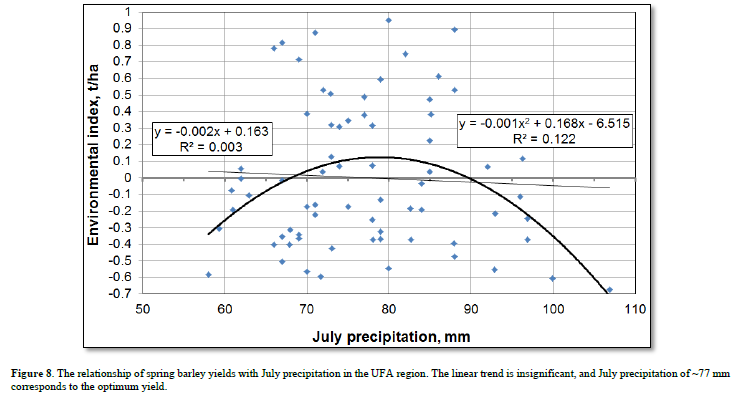
As for precipitation, although in any month it increases with increasing altitude following the usual orographic rule (fig. 6B), but the yield of barley has a certain optimum as a function of precipitation and therefore decreases with both not sufficient and excess precipitation Figure 8.
Thus, precipitation in July, with its proximity to normal (~77 mm), has a relatively small effect on the yield of spring barley in UFA, but due to the essential nonlinearity of the relationship, it can have a strong negative impact both in case of a shortage (drought) and an excess (waterlogging). The literature has repeatedly noted a decrease in the yield of spring barley both during droughts and during waterlogging.
The equation of multiple regression (the yield Ymis in t/ha) in UFA is
Ym = – 0.003530Z – 0.6045Tmin07 – 0.09116P03 + 0.01243P07 + 10.76;
R2 = 0.461, p<10–6, (1)
Where Z is land surface elevation, Tmin07 is July night-time temperature, P03 is March precipitation, and P07 is July precipitation. Here, all the predictors are significant, and the model explains 46% of the variance in barley yield. The relative contributions of the predictors are: 41.2% – elevation, 29.0% – Tmin07, 15.5% – P03 and 14.2% – P07.
The following can be seen from (1). With an increase in the July nighttime temperature Tmin07 by 1°C (with constant altitude and precipitation), the yield of barley decreases by 0.6 t/ha (by 38%). With an increase in the land surface elevation by 100 m (with other predictors constant), the yield decreases by an average of 0.35 t/ha (by 22%). An increase in July precipitation by 10 mm leads, on average, to an increase in the yield of spring barley by 0.12 t/ha (by 8%). However, it should be noted here that a more essential decrease (drought) or increase in July precipitation may lead to a significantly greater decrease in spring barley yields due to the general non-linearity shown in Figure 8 and explicitly not included in the model (1).

The land surface elevation in UFA is an integral characteristic that is associated with temperatures, precipitation, and soil moisture. Therefore, the daytime temperature and the diurnal temperature range were not included in the model: the effects of their influence on yield are already reflected by elevation, which is the main predictor in the model.
Note that as the desired environmental index noted in the Introduction, which does not depend on varieties and is determined by environmental factors such as precipitation and temperature [9], the value Imj = Ymj – Yav can now be proposed for UFA, where Ymj is the yield according to model (1), and Yav is the average yield in the districts of UFA (since environmental factors depend on the district, Ym depends on the j index, that is, it can be designated as Ymj). The found multiple regression equation (1), as usual, depends on the specifics of the region [18] (for example, a decrease in the night temperature of July Tmin07 with elevation and an increase in the daytime temperature of Tmax07, which is specific for UFA) and therefore may need to be modified for other regions.
With global warming, nighttime temperatures usually rise twice as fast as daytime temperatures, so that annual DTR decreases globally [19]. In the former USSR, for 40 years (1951-1990), annual Tmax increased by 1.4 °C/100 years, Tmin – by 2.8 °C/100 years, and annual DTR decreased by 1.4 °C/100 years [20]. This is attributed to an increase in cloud cover and a decrease in surface insolation [19]. Some regions were an exception, and DTR grew in them; for example, in India, the annual Tmax increased, while Tmin remained approximately constant [21]. In the UFA region, the yield of barley decreases with the growth of DTR07 (Figure 5B), therefore, a decrease in DTR07 will contribute to higher yields, mainly in lowlands (Figure 4B). Therefore, the choice of low-lying districts for the cultivation of not irrigated spring barley in the UFA region contributes to an increase in its yield both today and in the future.
Due to the different effects of Tmax and Tmin on barley yield, studies with artificial heating were conducted to separately assess the effect of these parameters on yield [22], as well as long-term experiments to assess the effect of Tmax, Tmin, DTR and solar radiation (Rad) on barley yield.
In the alpine climate of Tibet, the influence of these environmental factors on the potential yield (Yp) of highland spring barley has been studied for 40 years (1978-2017) [23]. 72 weather stations were located at altitudes of 2,450 to 4,000 m. The area was divided into five temperature zones using the sum of positive temperatures. Yp was estimated using the WOFOST simulation model. The effect of Rad on Yp in all zones was positive, while the influence of Tmax and Tmin changed from positive to negative with the decreasing altitude. This is because of cold conditions at high altitudes. Due to the low level of field management and the limited use of pesticides and fertilizers, the actual yield was on average ~2.2 t/ha, with Yp ~ 6.1 t/ha and yield gap ~ 3.9 t/ha. The largest Yp were at intermediate altitudes, indicating non-linear dependence of Yp on elevation [23]. It was noted also the non-linear effect of increased precipitation on barley yields in Tibet [24], which is similar to our result shown in Figure 8.
Due to global warming, the cold conditions in Tibet at an altitude of ~4000 m are replaced by moderate ones, so that from 1981-1983 to 2016-2018, the border of cultivation of highland barley rose by 240-484 m, to 4179 m a.s.l. [25]. There are no such “cold” districts in the UFA region, so warming here, which usually leads to a decrease in DTR, will contribute to an increase in spring barley yields, as shown in Figure 5B. However, this may be hindered by the increasing frequency of extreme events such as droughts.
CONCLUSION
In the Ural Federal Area (UFA), districts vary significantly in the land surface elevation Z, from 50 to 528 m. At the same time, air temperature, precipitation, and soil moisture depend on Z, which is why the yield of spring barley is associated with Z, so that for all districts located at an altitude of more than 300 m, the yield is lower than the average. The multiple regression equation we obtained (1) allows us to estimate the change in barley yield when one or more environmental factors change, assuming the constancy of the rest. For example, when the July night temperature increases by 1°C, the yield of barley in UFA decreases by an average of 0.6 t/ha, and when choosing the location of a barley cultivation area 100 m higher it decreases by 0.35 t/ha. The situation with significant deviations in summer precipitation is somewhat more complicated due to the non-linearity. In the case of strong changes in summer precipitation, the yield of barley decreases both with a decrease (drought) and with an increase (waterlogging). A small 10 mm increase in July precipitation relative to the norm leads to an increase in the yield of spring barley by 0.12 t/ha in UFA.
It is shown that climatic factors in UFA significantly depend on altitude and how namely: in summer, daytime temperatures increase with increasing altitude, while nighttime temperatures decrease. This is valid for the UFA region, but it may be different for other regions. When choosing districts of barley cultivation, it makes sense to assess their altitude position and the associated specifics of climatic factors.
An environmental index independent of cultivars, determined by environmental factors and specific, apparently, for the UFA region, has been introduced.


No Files Found


Internationally Accepted
Share Your Publication :