
-
Publish Your Research/Review Articles in our High Quality Journal for just USD $99*+Taxes( *T&C Apply)
Offer Ends On
Publish Your Research/Review Articles in our High Quality Journal for just USD $99*+Taxes( *T&C Apply)
Offer Ends On
Dienye Blessing E , Ugboma Enighe W* , and Emem-Chioma Pedro C
Corresponding Author: Ugboma Enighe W, Department of Radiology, University of Port Harcourt. /University of Port Harcourt Teaching Hospital, Nigeria.
Received: April 19, 2024 ; Revised: January 24, 2025 ; Accepted: January 27, 2025 ; Available Online: March 19, 2025
Citation: Dienye Blessing E, Ugboma Enighe W & Emem-Chioma PC. (2025) Ultrasound Correlation of Renal Indices with Creatinine Levels in Chronic Kidney Disease in a Tertiary Hospital, South Nigeria: A Pilot Study. J BioMed Adv Clin Res, 3(1): 1-7.
Copyrights: ©2025 Dienye Blessing E, Ugboma Enighe W & Emem-Chioma PC. This is an open-access article distributed under the terms of the Creative Commons Attribution License, which permits unrestricted use, distribution, and reproduction in any medium, provided the original author and source are credited.
Views & Citations
Likes & Shares
Background: Chronic kidney disease (CKD) is a significant burden in sub-Saharan Africa, driven by hypertension, diabetes, and limited access to renal replacement therapy. Renal ultrasonography is a non-invasive method of CKD assessment, particularly in resource-limited settings.
Objective: To establish correlations between renal ultrasound findings (renal length, cortical echogenicity, corticomedullary differentiation) and serum keratinize in patients with CKD, and explore the use of ultrasound in disease severity estimation.
Methods: Cross-sectional study of 150 adults (18–65 years) with CKD in a Nigerian tertiary hospital. Renal parameters were evaluated with ultrasound (Mindray DC-6 machine), and serum creatinine was measured using the Jaffe method. Spearman's correlation and multivariate linear regression were used for association analysis.
Results: Mean age was 41.6 ± 12.0 years with male preponderance (62.7%). The most prevalent CKD etiology was hypertension (62%). Serum creatinine negatively correlated with renal length (r = -0.275, p = 0.001) and positively with cortical echogenicity (r = 0.572, p < 0.001) and loss of corticomedullary differentiation (r = 0.412, p < 0.001). Cortical echogenicity was the sole independent predictor of creatinine upon multivariate analysis (β = 2.115, p = 0.016). Higher grades of echogenicity (3–4) and absent corticomedullary differentiation were associated with elevated creatinine (10.63 ± 6.22 mg/dl and 10.36 ± 6.97 mg/dl, respectively).
Conclusion: Renal cortical echogenicity on ultrasound is strongly correlated with serum creatinine, illustrating its usefulness in CKD severity. Echogenicity grading can allow risk stratification in resource-limited settings. Policy recommendations are the increase in the availability of ultrasound and standardization of protocols. Study limitations are single-center design and subjective echogenicity grading. Validation in other populations is required.
Keywords: Chronic kidney disease, Renal ultrasonography, Serum creatinine, Sub-Saharan Africa, Disease severity
INTRODUCTION
Chronic kidney disease (CKD) is characterized by a gradual decline in renal function, as indicated by a glomerular filtration rate of 60 mL/min/1.73 m2 or impaired kidney function lasting a minimum of 3 months [1]. Chronic kidney disease (CKD) is characterized by the loss of more than 50% of nephrons, resulting in impaired excretory function and an elevated risk of cardiovascular complications [2,3]. Serum creatinine is naturally produced and filtered by healthy kidneys. Still, it builds up when kidney function is decreased, which helps determine the stage of chronic kidney disease (CKD) [3]. The global prevalence of CKD varies between 8-19.9%, influenced by different definitions and populations [4,5]. The frequency in Nigeria varies between 8% and 45.5%, contingent upon the specific context and presence of comorbidities [6,7]. Chronic kidney disease (CKD) exhibits a higher prevalence among young adults in sub-Saharan Africa compared to affluent nations [8-10], mostly due to the presence of endemic infections and the increasing prevalence of non-communicable diseases such as glomerulonephritis, HIV and increasing incidence of essential hypertension and diabetes [11,12]. The individual and economic burden is substantial as a result of the expenses associated with treatment and the restricted availability of renal replacement therapy [13-16]. The importance of early detection and prevention cannot be overstated [17].
Chronic kidney disease (CKD) diagnosis combines clinical characteristics, blood and urine biomarkers, and imaging techniques [1]. Renal ultrasonography is a non-invasive method that examines the kidneys' structure without radiation, and it can help uncover treatable problems [18-21]. Advanced disease is shown by the presence of small, echogenic kidneys [20].
This study aimed to investigate the potential correlation between renal length, cortical echogenicity, and corticomedullary differentiation on ultrasonography and serum creatinine levels in patients with chronic kidney disease (CKD) in Nigeria. These correlations can facilitate the use of ultrasonography in estimating glomerular filtration rates, hence assisting in diagnosing and monitoring low-access laboratories. Establishing connections between imaging and biomarkers could enhance chronic kidney disease (CKD) characterization in areas with limited resources.
STUDY DESIGN AND SETTING
This cross-sectional study was conducted over 12 months at the radiology department at the University of Port Harcourt Teaching Hospital, a tertiary hospital in Port Harcourt, Nigeria. Adult CKD patients aged 18-65 years referred from the nephrology unit were recruited. CKD was defined as evidence of kidney damage ± glomerular filtration rate 2. The sample size was calculated using Fisher's formula [21] and 10% CKD prevalence from a prior study [22]; 150 patients were enrolled. A serum creatinine analysis using a modified Jaffe kinetic method was performed. Ethical approval was obtained from the Hospital Ethics Committee [23]. Bivariate correlations between continuous variables were assessed using Spearman's rank correlation coefficient due to non-normal distributions. Multivariable linear regression with creatinine as the dependent variable was performed using a stepwise selection of independent predictors with p
Inclusion criterion
Patients diagnosed with CKD in the Nephrology Unit (as evidenced by the presence of markers of chronic kidney damage whether or not the GFR is reduced) and patients with CKD who were between the ages of 18 years and 65 years (young and middle-aged adults).
Exclusion criteria
Patients who had any form of renal replacement therapy (dialysis or renal transplant), patients with fatty liver [24] (because their liver echoes will be raised, thus making it challenging to detect increased renal cortical echogenicity in early stages of CKD) or pregnant women (as physiological renal changes in pregnancy may mask CKD).
IMAGING PROTOCOL AND ANALYSIS
Ultrasounds were performed using a. Mindray DC-6 ultrasound machine with a 2.5-3.5 MHz convex probe for all ultrasound exams. The tests were conducted under the supervision of two experienced radiologists. Various imaging techniques like speckle reduction and low tissue harmonic imaging were used to improve the visualization of organ echogenicity. The gain and time again compensation adjustments were made manually for each patient to ensure impartiality, thus adjusting the image quality as needed. Furthermore, information on the serum creatinine level of each patient during the scans was blind to the sonologist. Differences in the observations were re-evaluated till a consensus was reached.
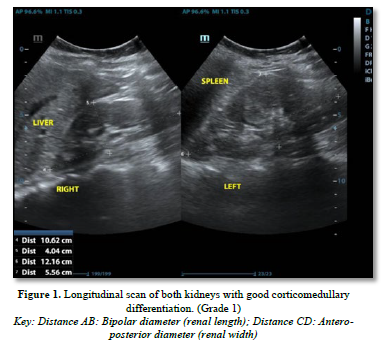
The following parameters were measured (Figures 1 & 2):

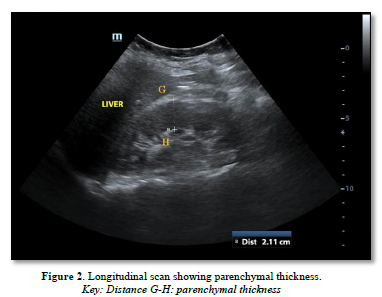
Renal length: Longitudinal bipolar maximum (pole to pole)-normal length: 9-12cm
Cortico-medullary differentiation was assessed as the visualization of the pyramid /cortex as distinct from the sinus and graded as maintained, poorly maintained, or lost.
Cortical echogenicity: Graded 0-4 vs. liver echogenicity and differentiation.
Renal Cortical Echogenicity Grading [25]
Renal cortical echogenicity was graded on a scale of 0-4 by comparing it to the echogenicity of the liver and medulla, using a standardized grading scale for the liver: Less echogenic than the liver; Equal echogenicity to the liver; Greater echogenicity than the liver with maintained corticomedullary differentiation; Greater echogenicity than the liver with poor corticomedullary differentiation; Greatest echogenicity with loss of corticomedullary differentiation.
RESULTS
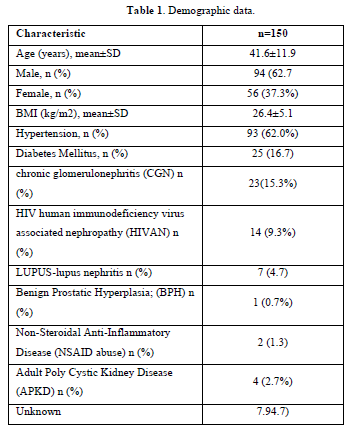
Demographic data (Table 1)

150 adult CKD patients with a male-to-female ratio of 1.67:1 was recruited. The mean age was 41.59±11.97 years for males and 40.86±12.48 years for females. Hypertension, present in 93 patients (62%), was the leading cause of CKD, including those with hypertension alone or with diabetes mellitus. Mean blood pressure was 151.22±27.92/93.70±18.2 mmHg. The majority, i.e. one hundred and thirty-nine patients (92.7%), had elevated serum creatinine (˃1.2mg/dl), while only eleven patients (7.3%) had normal serum creatinine.
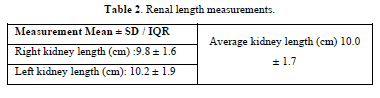
Measurements of the kidney's length were averaged to get the mean (Table 2). The mean renal length and serum creatinine showed a statistically significant negative correlation (r=˗0.275, p=0.001), showing creatinine levels decrease as length increases.
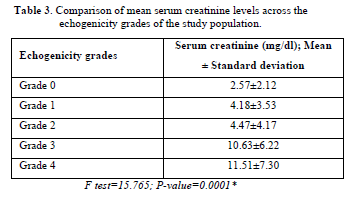
Bivariate correlations were assessed between the dependent variable (serum creatinine level) and each of the independent renal ultrasound parameters (length, echogenicity grade, corticomedullary differentiation) using Spearman's rank correlation coefficient. Spearman's correlation was chosen as the data were not normally distributed. (It assesses how strongly two variables change together in a monotonic manner without assumptions of linearity. Values can range from -1 to 1, with -1 indicating a perfect negative correlation and 1 a perfect positive correlation.) Spearman's correlation between serum creatinine and echogenicity grading showed a positive statistically significant correlation (r=0.572 p=0.0001)
Table 3 shows the results of these bivariate correlation analyses. Higher echogenicity grade correlated positively with creatinine (ρ = 0.572, p<0.001), showing that the change is in the same direction. Corticomedullary differentiation positively correlated with creatinine (ρ = 0.412, p<0.001).
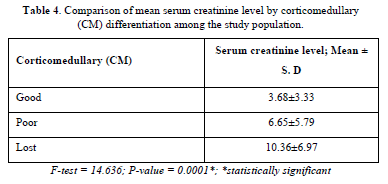
There was also a statistically significant relationship between the categories of corticomedullary differentiation and serum creatinine (Table 4).

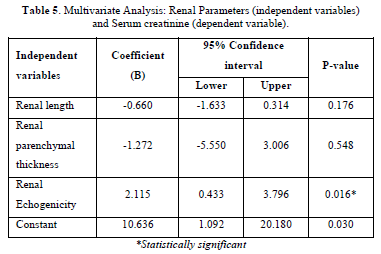
The multiple linear regression analysis showed that renal echogenicity was the only predictor of increasing serum creatinine (p<0.05). The coefficient (B) for renal echogenicity shows that, with one grade increase in echogenicity, serum creatinine increases by 2.115 (coefficient =2.115; 95% confidence interval: 0.433 - 3.796) see (Table 5).
DISCUSSION
The burden of CKD in developing countries is substantial due to the high costs of managing the chronic disease [1,15-17]. CKD is a leading cause of morbidity and mortality in our environment, influenced by increasing rates of diabetes and hypertension [1]. CKD can be diagnosed through laboratory renal function tests (serum creatinine, proteinuria, hematuria, urea) or radiological abnormalities [1]. This study aimed to identify the renal ultrasound parameter most correlated with increased serum creatinine in CKD patients.
The mean age of patients in this study was 41.59±11.97 years; however, the study by Korkmas [26] showed a mean age of 65.2 years, while that done by Singh [25] had a mean age of 54.32 years. Patients in the 4th and 5th decades contributed about 57% of the study population in this work. Thus, CKD occurs in a relatively younger population as opposed to studies done in other climes where CKD occurred in the older population [11,26,25]. This may be attributed to the rising incidence of hypertension in younger age groups and with a known black predisposition to hypertension, rising incidence of type 2 diabetes among younger age group and CGN from infective causes in our environment. The study done by Singh [25] in India showed diabetes as the most known common cause (32%) as opposed to this study, where hypertension was the leading cause with an overwhelming 62%, followed by diabetes (16.7%). Alebiosu [26], however, found CGN (45%) to be the most common cause of CKD in our environment, followed by hypertension (21%) before diabetes (13%). Hypertension in CKD can be either a cause or sequelae of the disease, and its presence is a poor prognostic factor, mainly if not well controlled. More males than females were recorded in this study (94 males, 56 females) in a ratio of 1.7:1. This was similar to findings from various studies worldwide [26,27]. This may be attributed to differences in physiology between the sexes. Females’ especially premenopausal ones are known to have a slower rate of progression to end-stage disease than men, which could be due to the effect of estrogen. Thus, end-stage renal disease is common in men. Men tend to initiate dialysis more commonly than women [28]. It should also be noted that this study had more patients in the late stages of the disease, so this preponderance is unsurprising. Stage 3 disease is common in females, but at this stage, the disease may likely be asymptomatic, which may explain the fewer women in this study [28].
Renal length is usually the parameter reported by sonologist and is regarded as a traditional predictor of CKD [29,30]. However, although it is easy to measure, it doesn't always give a good indication of the size as it doesn't consider the individual patient's body habitus. On the other hand, renal volume has been argued to even be a better predictor of size than renal length alone [30,31] but evaluating the renal volume, especially in a clinical scenario, is usually difficult because it has to be calculated, especially using the ellipsoid formula and the sinus which is not really part of the functional tissue is included in the calculation giving a false increase in volume [30].
In this study, most patients had normal kidney lengths, with only about a third having small kidneys, and only about 11% having renomegaly. Renomegaly is due to causes such as adult polycystic kidney disease, diabetes mellitus, unilateral kidney and HIVAN, which are known causes of increased renal size. Other studies showed the opposite; however, this could be due to the population in question, the body habitus or age [24,25]. This corroborates and supports the views by Milectić [34] that relative renal length is better than absolute renal length. There was a statistically significant negative correlation between the renal lengths on both right and left and mean renal length and serum creatinine. This agreed with other researchers [27], however. However, Singh [25] found no correlation between the two variables.
The highest frequency of patients in the study had grade 3 echogenicity, followed by grade 4- which represents end-stage renal damage. And higher mean values of serum creatinine across the echogenicity grades. This was in contrast to the findings by others where patients where the highest frequencies occurred in grade 2 and grade 1 diseases, respectively [24,26]. This was attributed to the fact that their studies were based in a referral center and as such, most end-stage patients had received one form of renal replacement therapy or the other, and so were excluded. This study showed an increase in patients with more advanced stages of disease despite it also being done in a referral center. Most patients were eligible for replacement therapy but could not do so due to lack of funds. Also, most patients in our environment usually present very late.
There was a positive statistically significant correlation between the renal echogenicity grades and the serum creatinine levels in CKD patients who partook in this study [25,27]. The mean serum creatinine for each grade showed that as serum creatinine increased, there was also an increase in renal echogenicity in all the studies. This is important as renal echogenicity is an irreversible finding compared to serum creatinine, which can be reversed with treatment. Using the multiple linear regression model for the significant variables, it was found that renal echogenicity was the only predictor of serum creatinine. Renal echogenicity is thought to be caused by interstitial fibrosis, sclerosis, focal tubular atrophy, hyaline cast per glomeruli and focal leucocytic infiltration [33]. Pävänsalo [34] reported that an echogenic kidney was the most reported finding in CKD and was usually more associated with the tubule-interstitial disease; this was also corroborated by Hricac [33], who observed that the degree of severity of renal echogenicity correlated with the severity of sclerosis and focal tubular atrophy [34,35].
Cortico-medullary differentiation as a renal parameter seen on ultrasound is closely related to the parenchymal thickness and echogenicity. Cortico-medullary differentiation is best seen in children, and the distinction decreases as one gets older [32,35], the Sino-parenchymal differentiation is observed, i.e., the parenchyma (medulla and cortex) being distinct (hypoechoic) compared to the very echogenic central sinus, which contains the calyces and fat.
Cortico-medullary differentiation was lost and poorly maintained in about 4/5th of the study population. This is in keeping with the fact that the bulk of the patients in the study were in grade 3 and 4 echogenicity and advanced CKD. Cortico-medullary differentiation was maintained in only about 1/5th of the study population. Other studies Alebiosu [25], Siddapa [26] & Carrero [27] showed that the cortico-medullary differentiation was kept in a more significant proportion of the study population (77-90%); this was attributed to the fact that their patients fell into the earlier stages of CKD with earlier grades of echogenicity and thus preserved cortico-medullary differentiation. The differences in the mean serum creatinine across the different categories of corticomedullary differentiation showed a statistically significant relationship. With worsening cortico-medullary differentiation, the mean serum creatinine increases.
In summary, renal ultrasound, particularly echogenicity grading, has prognostic significance through its association with biochemical indicators of chronic kidney disease (CKD) severity. The stratified analysis revealed a significant association between greater echogenicity grades. It worsens creatinine levels in advanced stages of chronic kidney disease (CKD). This indicates that renal ultrasound, specifically the evaluation of cortical echogenicity, may aid in identifying individuals who are at the most significant risk of experiencing accelerated disease development and would greatly benefit from intensive treatment or closer observation. More extensive prospective cohort studies are needed to validate quantitative ultrasound parameters as surrogate endpoints to guide diagnosis and management globally. Community-based screening with renal ultrasound also merits investigation to enable earlier CKD detection and intervention.
POLICY RECOMMENDATIONS
Governments should increase access to basic ultrasound technology in primary care. Nephrologists and radiologists should collaborate by utilizing ultrasonography for CKD monitoring and research. Standardizing quantitative ultrasound reporting could help validate its role in global CKD surveillance.
LIMITATIONS
The referral hospital cohort may not represent the general population, as it primarily consists of patients in advanced stages of illness.
Furthermore, the impact of factors such as muscle mass, medications, and comorbidities on creatinine levels has not been fully considered.
The single-center design and specific demographic characteristics of the tertiary hospital cohort may limit broader generalization until findings are replicated in diverse primary care populations.
While providing potentially useful information, echogenicity grading relies on subjective visual assessment. Inter-observer variability cannot be ruled out despite quality control efforts using standardized scales and blinded reads. Automated image analysis techniques may help address this limitation.
LINE OF FURTHER RESEARCH
Community-based case-control studies with larger sample sizes are advocated.
Multicenter validation of echogenicity grading and other parameters as surrogate endpoints.
Studies evaluating ultrasound for guiding therapy in limited resource settings.
DECLARATION OF CONFLICTING INTERESTS
The authors declared no potential conflicts of interest with respect to the research, authorship, and/or publication of this article.
FUNDING
The authors received no financial support for the research, authorship, and/or publication of this article.


No Files Found


Internationally Accepted
Share Your Publication :