
-
Publish Your Research/Review Articles in our High Quality Journal for just USD $99*+Taxes( *T&C Apply)
Offer Ends On
Publish Your Research/Review Articles in our High Quality Journal for just USD $99*+Taxes( *T&C Apply)
Offer Ends On
Altaf Hussain*, Padder and B Mathavan
Corresponding Author: Altaf Hussain, Assistant Professor, Department of Economics, Jammu and Kashmir Higher Education – India 192212. Professor and Head, Dept of Economics, Annamalai University, Chidambaram Tamil Nadu, India.
Received: July 07, 2026 ; Revised: July 08, 2026 ; Accepted: July 16, 2026 ; Available Online: July 17, 2026
Citation:
Copyrights:
Views & Citations
Likes & Shares
This study uses a global comparative framework to analyze how India’s macroeconomic structure changed between 1980 and 2025. Using semi-quadratic trend models, kinked exponential growth equations, and panel regression analysis, the study examines sectoral shifts, trade dynamics, external balances, and fiscal trends using data from 24 countries classified as advanced, emerging, and low-income economies in comparison with India examined separately. The findings emphasize India’s distinct growth trajectory, which is a service-led model supported by high investment rates but limited by ongoing fiscal and current account deficits. While the post-2008 Crisis and Realignment phase reflect external shocks, falling export competitiveness, and fiscal strain, the Reform and Rise phase (1995–2007) stands out as India’s period of peak growth. Comparative panel regressions reveal that India performs worse in terms of external sustainability than ASEAN and BRICS, even though it maintains a high level of trade openness. In order to establish long-term resilience in a fragmented global economy, policy proposals place a strong emphasis on the necessity of export diversification, fiscal consolidation, and industrial deepening.
Keywords: Indian Economy, Global Economic Crises, Economic Transformation, Trade War, Economic Growth, Fiscal Dynamics.
INTRODUCTION
India's macroeconomic development has changed significantly over the last forty years due to changes in domestic policy, changes in the global economy, and industry realignments. India's economy has changed from being primarily agrarian and inward-looking in the 1980s to becoming a vibrant, service-led market that is becoming more and more entwined with international trade and financial flows(Soni & Subrahmanya, 2020). However, this change has not been consistent or linear. Instead, it has developed across several structural stages, each of which reflects a different arrangement of national and international forces(Padder & Bommayasamys, 2023). In order to assess historical performance and develop strategies that ensure long-term resilience and competitiveness in a post-globalization environment, it is essential to comprehend the character, extent, and direction of India's macroeconomic trajectory from a comparative standpoint.
With the conclusion of the Cold War, the advent of neoliberals, the rise of China, the 2008 Global Financial Crisis, and more recently, the COVID-19 epidemic and related geo-economics realignments, the 1980–2025 period embodies a chaotic and revolutionary era in the history of the world economy (Padder, 2023; Ahmad& Alam, 2024). A complex story of late but considerable reform, quick development, uneven structural change, and enduring external vulnerabilities can be seen in India's economic evolution throughout this time. This study uses a rigorous, comparative framework based on empirical modeling to examine that narrative. India experienced a balance-of-payments crisis in 1991, which led to extensive economic reforms and the introduction of globalization, privatization, and liberalization (LPG). The License-Permit Raj was abolished, industries were deregulated, and trade and investment restrictions were lowered as a result of the crisis, creating a structural shift toward an open economy (Nayyar, 2017). A new, service-led economic trajectory has emerged, signaling the end of the "Hindu Rate of Growth," a term used to characterize sustained sub-4% growth rates that were common between the 1950s and 1980s(Rodrik et al., 2004).
Systematic changes in the sect oral contributions to GDP and employment frequently accompany economic expansion. Lewis (1954) introduced the dual-sector hypothesis, which was the first model to frame this as structural transformation. Lewis argues that wage disparities move excess labor from subsistence farming to urban-industrial sectors, facilitating long-term economic growth. This was further developed by Kuznets (1966, 1973), who showed a step-by-step progression from agriculture to industrialization to services, each of which was marked by a unique increase in productivity. This multi-sect oral model was expanded upon by Chenery and Syrquin (1975), who provided actual evidence of how countries change as their GDP increases, moving labor and output from agriculture to industry and, eventually, services. Jha and Afrin (2021) confirmed the applicability of these structural transformation frameworks in the South Asian context, pointing to sect oral reallocation as the main force behind regional economic growth.
However, India's structural reform has taken a non-traditional route. The nation has shifted straight from agriculture to services, avoiding a manufacturing-led period as is typically expected; this is known as "stunted structural transformation" (Kalaiyarasan, 2022; Roy Bardhan & Sarkar, 2024). Manufacturing employment remained between 10% and 12% between 1960 and 2010, whereas high-productivity service industries, including business services, insurance, finance, and real estate, increased fivefold (IMF, 2018) and (Padder &Mathavan, 2022). Rapid expansion in the service sector successfully absorbed labor leaving agriculture, creating a direct agrarian-to-service transition, according to Ahsan and Mitra (2017) and Fan et al. (2021). This labor-productivity wedge was highlighted by Roopali Aggarwal (2021), who demonstrated that more than 40% of India's workforce is still employed in agriculture, even though the sector's GDP contribution decreased from 42% in the 1970s to about 15% to 20% by 2020. Manufacturing continues to account for about 10% of value-added output in the meantime (Siddiqui, 2024). According to Roy Bardhan and Sarkar (2024) and Kalaiyarasan (2022), this structural pattern is a hurdle to attaining comprehensive industrial growth as well as a result of economic resilience.
Agriculture still employs over 40% of the workforce despite its declining GDP contribution (Kannan & Pohit, 2021; Siddiqui, 2024), indicating a large efficiency gap. Systemic barriers that small and marginal farmers must contend with include inadequate infrastructure, low levels of investment, and restricted access to formal credit (Kannan et al., 2021). The unequal allocation of input subsidies has limited welfare results, even if they have helped attract private investment (Gulati & Chopra, 1999). Furthermore, while the Green Revolution's benefits resulted in higher yields, they also eventually increased environmental stress and farmer suffering (Sandhu, 2014; Shiva, 1991). Rural infrastructure, digital connection, and market integration have received fresh attention as a result of the COVID-19 pandemic's increased exposure of rural India's vulnerabilities.
In addition, India's service industry—specifically, ICT, banking, and business services—has been a significant contributor to the country's economic expansion. By utilizing global Diaspora networks and monetizing India's skilled English-speaking workforce, the liberalization of telecommunications and associated policies promoted service exports (IMF, 2018; IMF, 2024). Research on total factor productivity (Saia et al., 2015; Bolhuis, 2019) showed that ICT services have a favorable impact on the economy as a whole. Das (2025) and Fan et al. (2021) contend, however, that despite these industries' high efficiency, they have only created a small number of high-productivity jobs. This leads to what is commonly referred to as "jobless growth" in India, where a large portion of the workforce continues to work in low-productivity or informal jobs (IMF, 2018; Fan et al., 2021; Das, 2025).
After a balance-of-payments crisis in 1991 prompted extensive liberalization initiatives, including the demolition of the License-Permit Raj, the lowering of trade barriers, and the promotion of foreign investment, India undertook a dramatic change (Ahluwalia, 2002). Trade openness increased significantly as a result of these reforms, and between 1990 and 2000, the trade-to-GDP ratio almost doubled (OECD, 2024). According to Philippe et al. (2008), these measures have improved labor market results. But there were also unforeseen repercussions from the entry into international markets. Trade openness exacerbated rural-urban disparity (Ghosh, 2020; OECD, 2024) and extended current account deficits and import dependency (OECD, 2024) and (Hussain, 2025).Capital inflows increased as a result of the deregulation of capital accounts after 1991, making the economy more vulnerable to shocks from throughout the world (OECD, 2024). The actual exchange rates mean-reversion behavior changed when Mishra et al. (2014) found structural cracks in the rate. In years like 2011, 2014, and 2020—all of which corresponded to macro-financial shocks—Parab and Reddy (2019) and Bhattacharjee and Das (2023) found structural changes in domestic financial variables. These works examine nonlinear modifications in these series using Bai–Perron structural break tests.
Persistent deficits in India's fiscal framework continue to be a threat to macroeconomic stability. Although subsidies have reduced the effectiveness of capital expenditures, public investment in agriculture has demonstrated beneficial spillover effects on private investment (Akber, Paltasingh, & Mishra, 2022). Input subsidies are prioritized above long-term assets in central government budgets, which restricts structural rural development (Akber, Paltasingh, & Mishra, 2022). Incentives for the service sector have drawn foreign direct investment, but they have also led to a thin industrial base (IMF, 2024). India's developmental trajectory is contextualized inside and outside of South Asia through comparative study. Aggarwal (2021) discusses India's technological advancement in the context of the region, emphasizing the structural differences with nations that followed industrial paths. South Asian economies fall behind their East Asian counterparts in terms of industrial growth and productivity, according to Jha and Afrin (2021). In order to rebalance India's structural economy, the Institute for Studies in Industrial Development (2023) highlights the necessity of integrated MSME policies, increased FDI activity, and industrial regeneration.
The analysis of nonlinear economic trends relies heavily on empirical modeling of structural breaks. Strong frameworks for detecting several structural breaks were developed by Bai and Perron (1998, 2003), and Caporale and Grier (2005) and Mishra et al. (2023) confirmed these frameworks in macroeconomic settings. Their applicability to no stationary time-series modeling has been further validated by discussions on econometrics communities like Reddit (2023–2025). Bhattacharjee and Das (2023) incorporate break testing into ARDL models, while Parab and Reddy (2019) show how to use them with financial datasets. Similarly, Mishra et al. (2014) used the same methodology to investigate exchange rates. In structural change, recent research has tackled issues of economic resilience, sustainability, and equity. Sahasranaman and Kumar (2020) report that, particularly in rural areas, income disparity increased between 2014 and 2019. Concern for inclusive development is shown in the growing discussions surrounding digital transformation, circular economy models, and MSME resilience (Das, 2025; ISID, 2023). Discussions on post-COVID policy include a strong emphasis on sustainable structural change, rural value chain digitization, and industrial revitalization (Das, 2025; ISID, 2023).
There are still a lot of unanswered questions regarding India's structural transition, even with the depth of current studies. In particular, cross-country econometric evaluations using structural break methodologies are conspicuously lacking, and traditional models provide little insight into the nation's service-led shift. In order to overcome these shortcomings, this study compares India's performance with a few chosen peer economies using panel regressions, semi-quadratic trend models, and kinked exponential model. Placing India's macroeconomic development inside a strict, international analytical framework is the aim.
METHODOLOGY
Objectives of the Study
With an emphasis on the years 1980–2025, this study aims to examine the character and trajectory of India's macroeconomic transition within a worldwide comparative perspective:
By using statistical breakpoints to correlate macroeconomic turning points with significant policy changes or worldwide economic disruptions like liberalization in 1991, the Global Financial Crisis in 2008, and the COVID-19 pandemic in 2020, the study also aims to identify structural alterations.
Research Design and Data Sources
In order to examine India's macroeconomic development in comparison to other international country groups, this study takes a longitudinal and comparative approach, using quantitative approaches. The World Bank's World Development Indicators (WDI), the International Monetary Fund's World Economic Outlook (WEO), and UNCTADSTAT—particularly for foreign direct investment metrics—are globally reputable sources of data for the years 1980–2025. To allow for continuity in trend analysis, the time span incorporates both historical observations and projected values for 2023–2025.
A variety of macroeconomic variables are included in the dataset, such as GDP (constant prices), GDP per capita (PPP), sect oral composition (agriculture, industry, and services), inflation (average consumer prices), unemployment, current account balance, fiscal balance, government revenue, public debt, and foreign direct investment inflows. Data were modified, including normalization to GDP shares and log transformations, when necessary, to guarantee consistency across nations and time.
Country Grouping and Per iodization
For comparative purposes, countries are categorized into four groups:
This classification follows the latest available standards from the IMF and World Bank. Data are aggregated annually at the group level using arithmetic means.
The study period is segmented into three structural phases, validated through structural break testing:
These sub-periods are derived through application of the Bai–Perron multiple breakpoint test to core macroeconomic time series (e.g., GDP, trade openness, fiscal balance), with breakpoints clustering around 1995, 2008, and 2020.
Model Specification
Semi-Quadratic Time Trend Model
To identify long-run macroeconomic trends and curvature in growth paths, the study applies a semi-quadratic trend model. This approach accounts for both linear change and potential inflection points over time. The model is specified as:

Where:
This model is estimated separately for each country group and variable using OLS with robust standard errors.
Kinked Exponential Growth Model
To estimate segmented growth across distinct structural phases, a kinked exponential growth model is employed. This model allows for piecewise estimation of growth rates aligned with the three defined economic phases. The log-transformed equation is

Where:
The resulting coefficients are interpreted as phase-specific growth rates, with statistical significance tested for each.
Panel Regression with Country Groups
For comparative benchmarking, a panel data model is used to estimate macroeconomic performance across country groups. The model includes group dummies and time trends to isolate fixed group effects. This model identifies whether India’s macroeconomic patterns differ statistically from peer groups while controlling for temporal effects. All regressions are estimated using Ordinary Least Squares (OLS) with heteroskedasticity-robust standard errors. Model fitness is evaluated using R-squared values, F-statistics for overall model significance, and Durbin–Watson statistics to assess autocorrelation.
The model is specified as

Where:
α is the constant (intercept), representing the baseline outcome for the reference group (Advanced economies during the Crisis and Realignment phase)
βg estimates the effect of belonging to group g relative to Advanced economies
γp captures the effect of being in phase p, relative to the post-2008 Crisis phase
δgp represents the additional effect for countries in group g during phase p, relative to the additive effects of group and phase alone
All categorical variables are entered as dummy (factor) variables with reference categories omitted to avoid multicollinearity
Model Diagnostic Summary
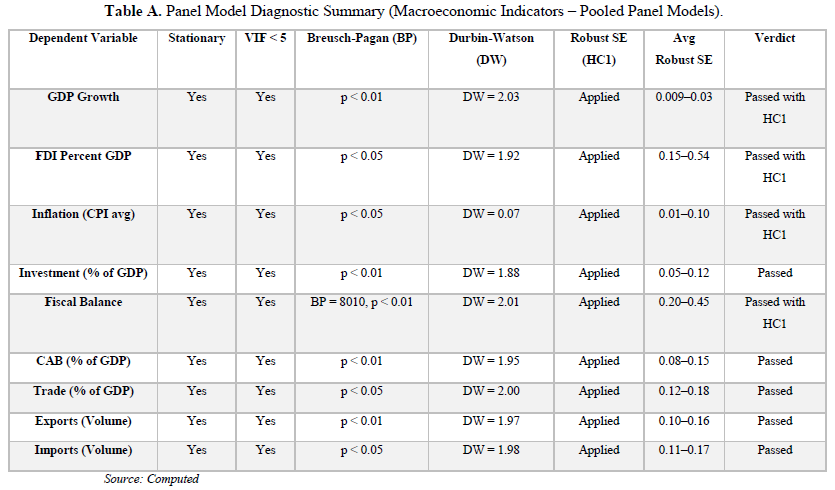
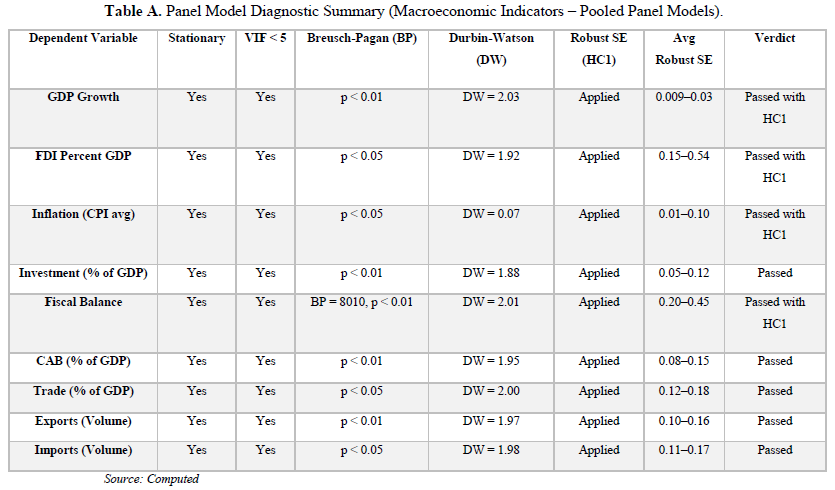
We ran a thorough series of diagnostic tests in R to make sure our pooled panel regression models were robust. Using the Variance Inflation Factor (VIF), multicollinearity was evaluated. Even after controlling for interaction terms, all models had VIF values below the recognized cutoff of 5, which indicates no substantial multicollinearity. The Breusch-Pagan test revealed heteroskedasticity in a few models (such as GDP growth, FDI, and fiscal balance); to remedy this, we used robust standard errors (HC1). The Durbin-Watson test was used to assess autocorrelation, and although inflation displayed serial correlation, robust standard errors were used to counteract this as well. Inherently or after transformation, all dependent variables were found to be stationary, including GDP growth, inflation, investment, foreign direct investment, fiscal balance, current account balance, trade openness, and trade volumes. This supports the validity of our findings across macroeconomic indices and validates our use of pooled OLS models with interaction factors.
RESULTS AND ANALYSIS
Assess India's Growth Trajectory in a Global Context
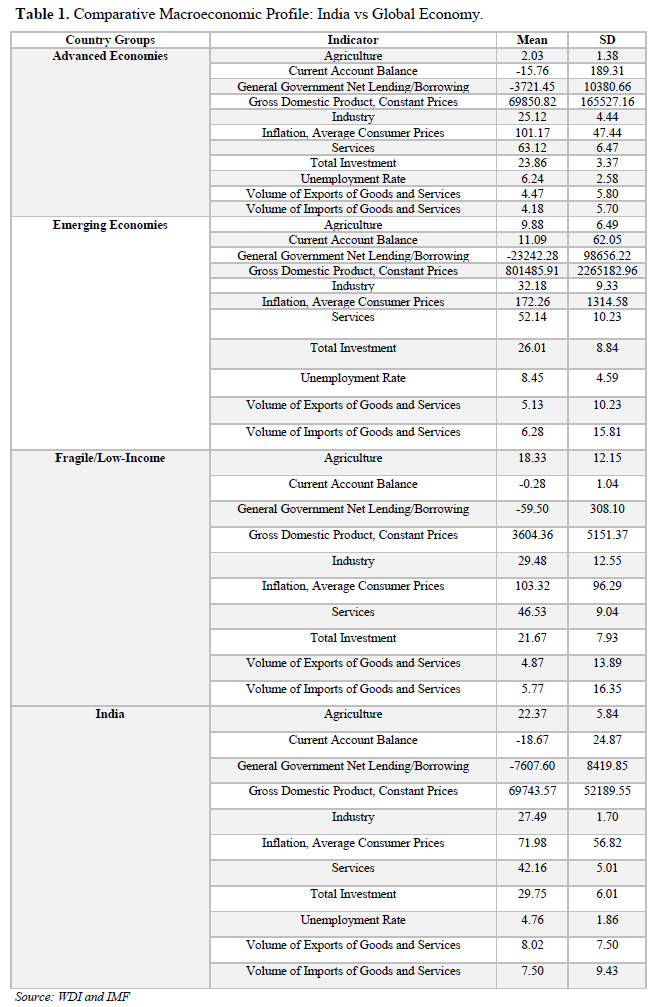
Comparative Macroeconomic Structures: India and the Global Economy
India's distinct economic identity in relation to its worldwide contemporaries across the spectrum of development is revealed by a thorough comparative analysis of macroeconomic data. With the services sector accounting for more than 42% of GDP, India stands out as a service-led economy. This is significantly higher than that of low-income and fragile nations (46.5%) and closely resembles emerging markets (52.1%). Despite the fact that India's services lag behind those of advanced nations (63.1%), this indicates a fundamental shift toward an urban-centric, knowledge-based economic model. The constantly low standard deviation in services (SD = 5.01) highlights the importance of the professional, financial, and IT industries as the backbone of the Indian economy and points to stability and maturity within this sector.
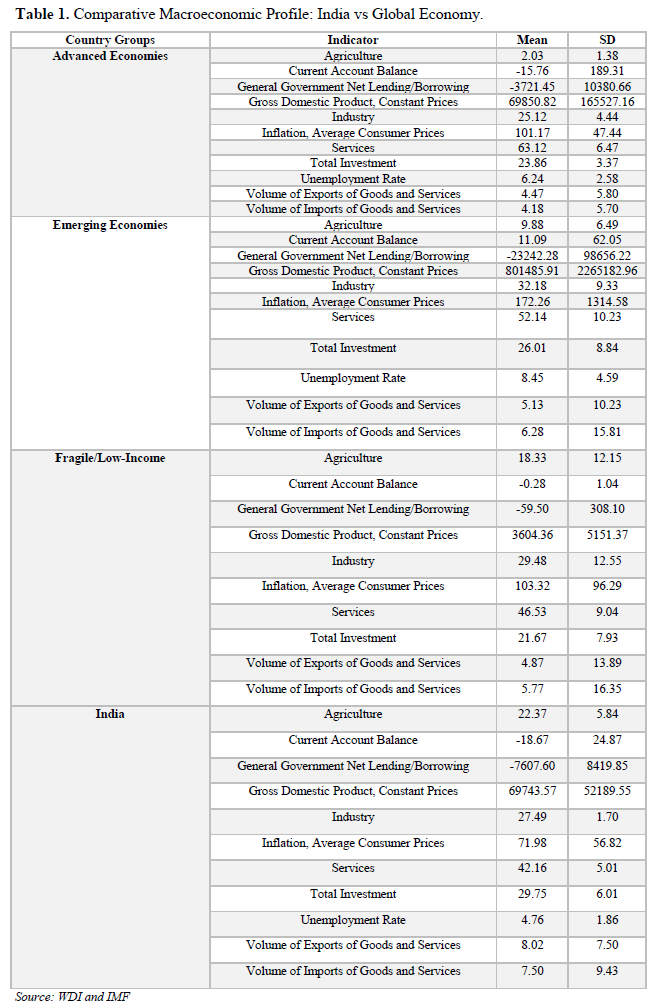
On the other hand, India continues to have a robust agricultural foundation, with agriculture making up 22.4% of GDP, which is higher than any other group in the sample. This number reflects a dual economic character, dwarfing the agricultural portions of both advanced (2.0%) and emerging economies (9.9%). India maintains a sizable rural agriculture sector while also promoting a contemporary, urbanized services economy. Understanding the intricacies of India's development path, where rapid modernization must coexist with agricultural dependency and rural livelihoods, requires an awareness of this dichotomy. With a GDP contribution of 27.5%, India's industrial sector is much stronger than in weak nations but still lags behind the developing economy average of 32.2%. This indicates a region of promise as well as challenge; by boosting manufacturing and diversifying exports, India's industrial policy strategy, which includes "Make in India" and production-linked incentives, may help close this gap. With total investment averaging 29.8% of GDP, the highest of all peer groups, India exhibits encouraging signs of strong investment activity. Strong domestic capital formation, a key factor in long-term productivity and employment creation is suggested by this.
Another noteworthy aspect is trade openness. India's increasing integration with international markets is confirmed by the fact that its export and import quantities, at 8.0% and 7.5% of GDP, respectively, exceed those of advanced, emerging, and fragile groups. However, there are enduring macroeconomic imbalances associated with this openness. With an average current account deficit of -18.7%, India's deficit is less severe than that of many emerging economies but still significantly larger than that of both advanced (-15.8%) and fragile countries (-0.3%). Another issue is fiscal vulnerability; India's government net lending/borrowing balance is negative (-7607.6), which is a symptom of ongoing deficits but far less dramatic than the volatility observed in larger emerging markets. Indicators of unemployment and inflation provide a contradictory image. Despite supply-side shocks and global headwinds, India's inflation rate of 72.0 is significantly lower than that of fragile economies (103.3) and developing economies (172.3), indicating rather successful pricing management. Although the headline unemployment rate of 4.8% seems low, it may mask underlying problems that are common in developing countries, such as informal employment, labor underutilization, and skill mismatches.
All things considered, the information places India at a pivotal point in its economic development. It is not yet as industrialized as some of its emerging contemporaries, nor is it as capital-rich or fiscally stable as established nations. India, however, has a hybrid economic structure that is based on services, supported by tenacity in agriculture, and distinguished by a high level of trade and investment. India is uniquely positioned for rapid growth due to its hybrid nature, but it also faces complex policy issues. India's future course in the global economy will be greatly influenced by a customized, sector-sensitive development strategy that prioritizes industrial depth, agricultural modernization, and global competitiveness.
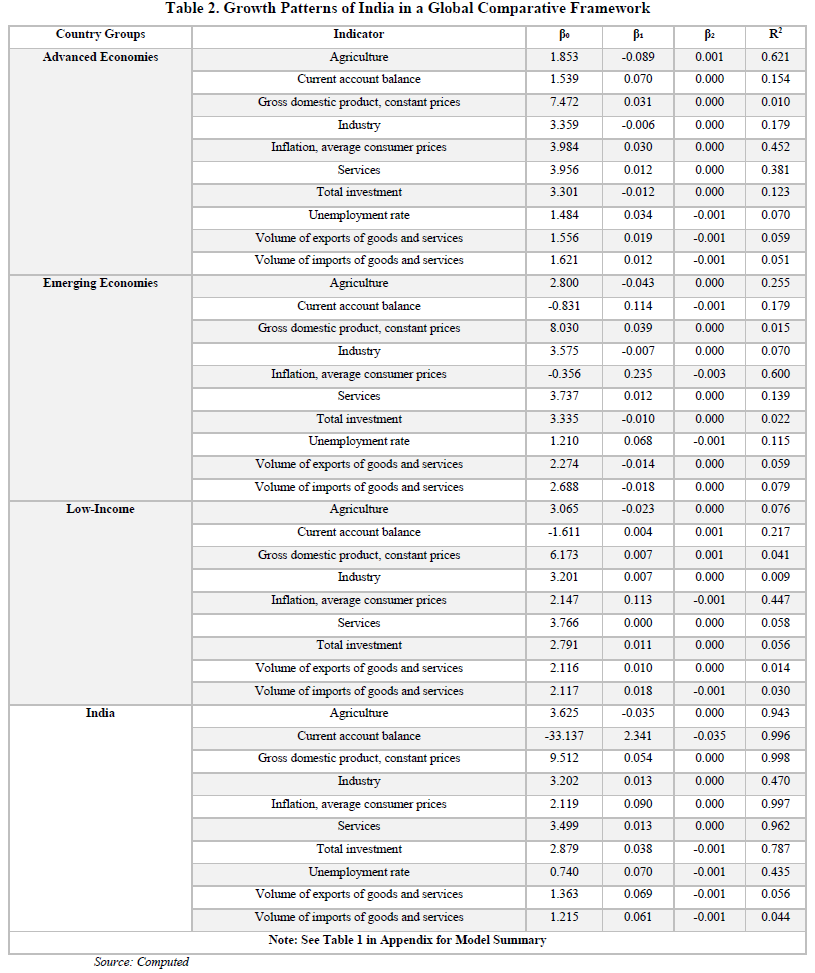
Using a semi-quadratic regression model, Table 2 compares India's macroeconomic growth indicators across three country groups: advanced economies, emerging economies, and low-income economies. Along with R² values to show the model's explanatory power, the model estimates three coefficients: the intercept (β₀), the linear trend (β₁), and the quadratic term (β₂). With consistently high R² values across the majority of indicators (such as 0.998 for GDP, 0.997 for inflation, 0.962 for services, and 0.943 for agriculture), India's performance is particularly noteworthy. This suggests that the semi-quadratic model accurately depicts the growth dynamics of the nation. These figures, on the other hand, are significantly lower for other nation groupings and frequently go below 0.2, indicating weaker or less consistent trends in those economies.
With a significant positive linear coefficient (β₁ = 0.054) and little curvature, India's GDP has a strong and stable upward trend, indicating steady growth. Additionally, inflation has a definite upward trend (β₁ = 0.090), underscoring the predictability of price changes in recent years. With a negative quadratic term (β₂ = -0.035), a big negative intercept (β₀ = -33.137), and a very high positive linear trend (β₁ = 2.341), the current account balance for India, on the other hand, exhibits a clear pattern that suggests initial rectification followed by continued instability. Other economies, on the other hand, exhibit significantly smaller and fewer fluctuating coefficients for this measure, suggesting more muted tendencies.
Growth Patterns of India in a Global Comparative Framework
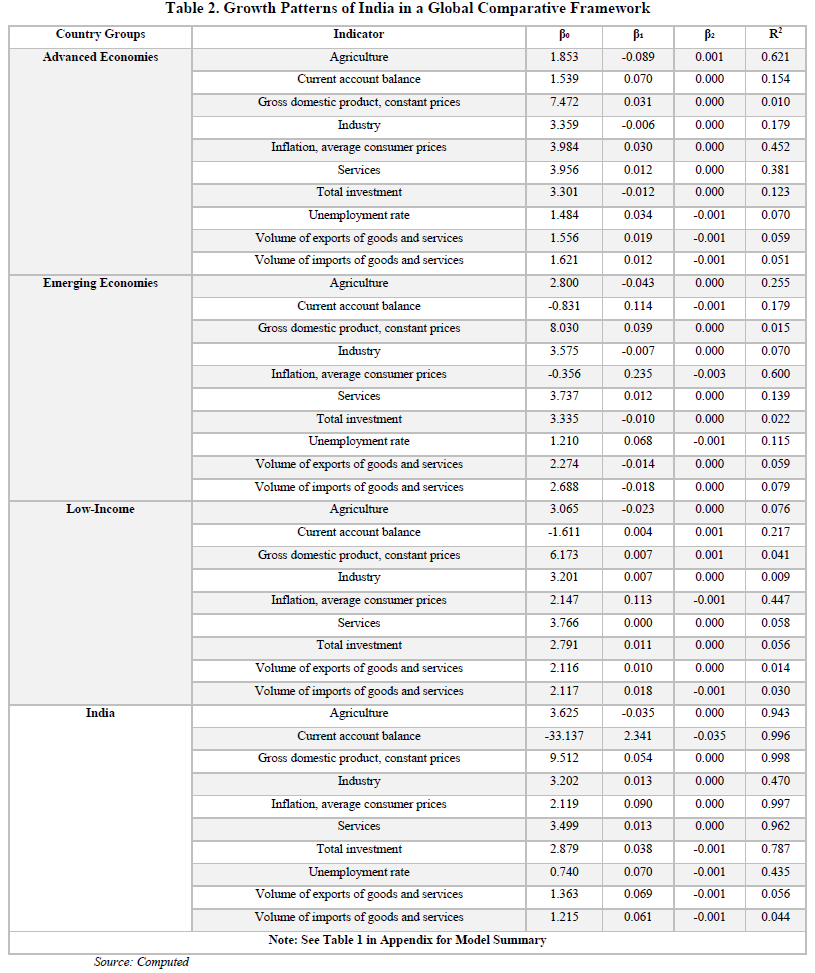
At the sector level, India performs well in industry (R² = 0.470; β₁ = 0.013) and services (R² = 0.962; β₁ = 0.013). Agriculture also shows a well-fitted, albeit marginally declining trend (β₁ = -0.035; R² = 0.943). A high R² value of 0.787 supports the overall investment trajectory in India, which shows steady positive growth (β₁ = 0.038) with a slight downward curvature (β₂ = -0.001). Modeling unemployment is moderately successful (R² = 0.435), exhibiting a small quadratic fluctuation and a tiny rising trend. However, trade-related variables, such as imports and exports, have comparatively lower R² values (0.056 and 0.044, respectively), indicating that they are less predictable due to their greater reliance on external shocks and global volatility.
Advanced economies GDP (0.010), total investment (0.123), and industry (0.179),R² values are quite low when compared internationally, suggesting that their growth patterns may be more intricate, sophisticated, or impacted by cyclical dynamics that are difficult for a straightforward semi-quadratic model to adequately reflect. In terms of metrics like unemployment (R² = 0.115) and inflation (R² = 0.600), emerging economies do marginally better than India, but they are still not as consistent. Low R2 ratings for nearly all variables, with the exception of inflation (0.447) and current account balance (0.217), indicate that fragile and low-income economies exhibit unpredictable or poorly explained patterns.
In conclusion, when compared to other countries, India exhibits a growth profile that is notably robust and well-organized. India's shift to a more resilient and predictable economy is highlighted by the strong R² values and noteworthy trends across important macroeconomic indicators. The internal dynamics of production, investment, inflation, and sect oral growth are still strong, but the current account and external trade need attention because of their relative instability. These results highlight India's distinct position, outperforming emerging and fragile countries in terms of consistency and durability while following a different path than developed ones.
Macroeconomic Transformation: India in Global Perspective (1980–2025)
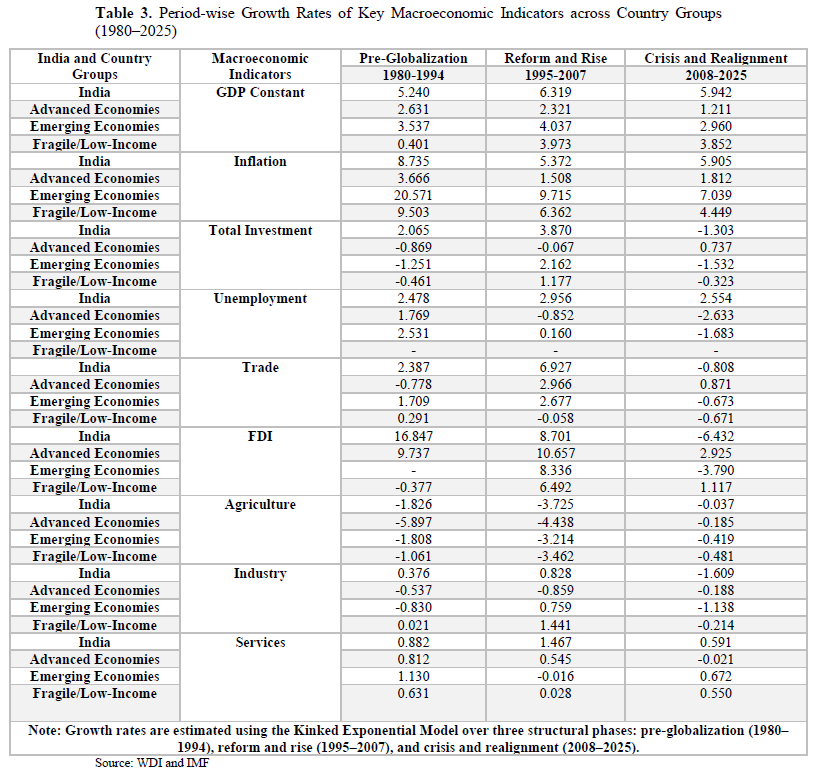
Table 3 presented both the structural changes in India's economy and its alignment with changes in the global economy are reflected in the macroeconomic performance trajectory over the last forty years. India's average GDP growth rate during the pre-globalization era (1980–1994) was 5.24%, which was modestly higher than that of developing economies (3.54%) and much higher than that of advanced nations (2.63%) and fragile economies (0.40). This trend picked up speed during the Reform and Rise era (1995–2007), when market reforms, economic liberalization, and growing global integration propelled India's GDP growth to a peak of 6.32%. During this era, India outperformed all other country groups. Growth remained considerably above world averages, particularly when compared to advanced economies (1.21%), even though it somewhat decreased to 5.94% during the crisis and realignment phase (2008–2025), probably as a result of global financial volatility, shocks brought on by pandemics, and geopolitical uncertainty.
Over time, inflation trends show a convergence. Prior to reform, India had high inflation (8.73%), which is common in developing nations. However, monetary reforms and inflation targeting reduced this to 5.37% between 1995 and 2007 and then it stayed steady at 5.91 percent. In contrast, developing and unstable economies demonstrated chronically high inflation, albeit with some moderation over time, whereas mature economies maintained moderate and steady inflation throughout.
Regarding investment patterns, India outperformed all other nation groups in terms of overall investment growth, which had an excellent pace during the reform period (3.87%). However, domestic infrastructure bottlenecks, muted private investment, and global risk aversion are the reasons for a considerable fall to -1.30% in the post-2008 period. While established economies show a modest recovery following 2008, developing and fragile economies show a similar slowdown. Although structural underemployment may be concealed, India's unemployment rate has consistently been positive throughout all time periods, indicating increased labor force participation and job growth. Advanced economies, on the other hand, saw a shift from positive unemployment growth in the 1980s to notable decreases following 2008, which were a result of labor market contractions. After 2007, unemployment growth in emerging economies decreased; however, data on unstable economies was inconsistent.
India's integration into global value chains was highlighted during the reform era when the trade-to-GDP ratio, a proxy for globalization, soared to 6.93%, surpassing all other groups. But in 2008, this turned back to -0.81%, indicating a rise in protectionism and disputes over international trade. Globally, similar slowdowns were noted, particularly in weak and emerging economies. Due to the low base and early deregulation, FDI inflows to India were extremely high during the 1980–1994 period (16.85% increase).
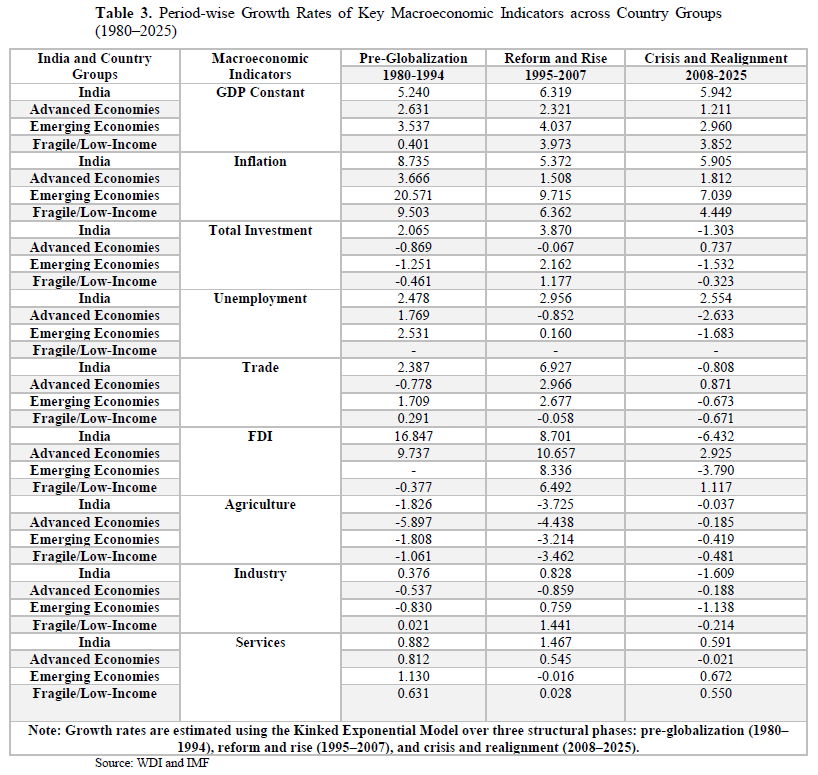
A steep drop (-6.43%) after 2008 indicates increased investor fear, regulatory obstacles, and competition from other emerging economies, even if growth persisted throughout the reform era (8.70%). Globally, emerging economies saw a sharp fall in foreign direct investment after 2008, while mature economies continued to grow at a modest rate.
According to the sectoral composition, India's agriculture sector saw a significant contraction (-3.72%) between 1995 and 2007 before stabilizing, which was in line with trends in structural transformation. The industry sector likewise saw a decline after 2007 (-1.61%), but services, the main driver of growth, continued to grow during all years, albeit with less vigor (0.59% after 2008). During the liberalization phase, India's service sector performed better than the others. During the post-crisis period, both advanced and fragile economies displayed mild contractions or stagnation in both industry and services, showing structural fragility or stagnation.
From a comparative standpoint, India's economic performance has generally been robust and growth-enhancing. During the reform era, it outperformed most peer groups in terms of GDP growth, trade openness, and service sector expansion. The post-2008 downturn in industrial growth, foreign direct investment, and investment, however, draws attention to new vulnerabilities. While emerging economies exhibit heterogeneity with moderating inflation and muted growth, established economies exhibit a tendency of deceleration and deflation. Underinvestment, inflation, and volatility are still problems for fragile economies. The comparative analysis emphasizes how important it is for India to concentrate on inclusive, resilient, and productivity-driven growth policies during this time of global realignment.
Evaluate Trade Integration and External Balance
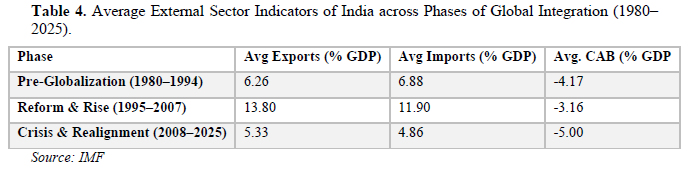
Over the past forty years, India's external sector has experienced a substantial structural transformation that reflects changes in macroeconomic strategy, trade policy, and global connectivity. India's pre-liberalization government was primarily inward-looking, but after the 1991 economic changes, it gradually embraced trade openness. This goal looks at how India's imports, exports, and current account balance (as a proportion of GDP) changed between 1980 and 2025. Three significant economic periods are included in the analysis: pre-globalization (1980–1994), reform & ascent (1995–2007), and crisis & realignment (2008–2025). These stages reflect different global macroeconomic and policy contexts that shaped India's trading strategy.
The average values of the three main external sector indicators such as, current account balance, imports, and exports, as a percentage of GDP for each of these three periods are shown in Table 4. With average exports and imports of 6.26% and 6.88% of GDP, respectively, India's external commerce was very modest prior to globalization. In a comparatively closed economy, the current account deficit (CAD) averaged -4.17% of GDP, indicating mild external imbalances. Restrictive trade policies, limited foreign exchange reserves, and import substitution techniques were prevalent during this time.
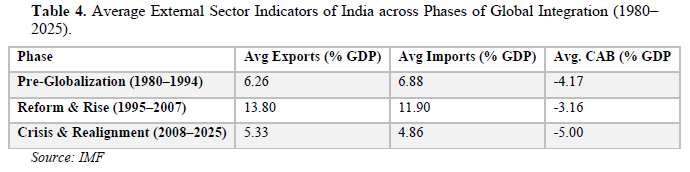
During the Reform & Rise Phase, there was a clear move toward international integration. Trade activity significantly increased as a result of liberalization policies, the lifting of quantitative constraints, and increased currency convertibility. India's growing involvement in global value chains is demonstrated by the fact that exports increased to 13.8% of GDP over this time, while imports averaged 11.9%. Thanks to an increase in remittance inflows and services exports, the current account balance improved somewhat to an average deficit of -3.16%. India's transformation into an emerging market economy with expanding global ties was highlighted during this time.
An unanticipated turnaround is revealed in the post-2008 crisis and realignment era. The slowdown in global demand, protectionist trends, and India's own inward-looking policy adjustments may have contributed to the declines in exports and imports as a percentage of GDP, which fell to 5.33% and 4.86%, respectively. Nonetheless, this phase's average current account balance shows an abnormally high deficit of -5.00% of GDP. However, the pattern points to a fundamental shift in India's focus on the external sector following the Global Financial Crisis and amid the post-crisis global shocks (such as COVID-19 and geo-economics tensions). In conclusion, the changes in trade and current account indicators accurately reflect India's transition from a protectionist government to a generally open economy. After the 1991 reforms, trade integration exploded, but recent years indicate a period of cautious globalization that reflects both internal recalibrations and foreign threats.
External Sector Performance: India vs. Peer Groups
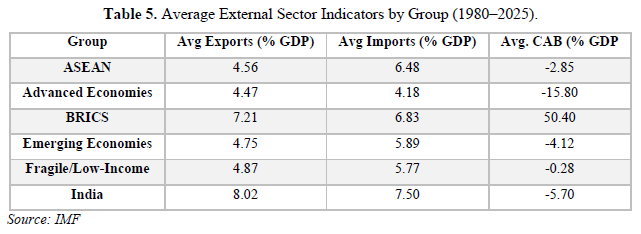
Assessing a nation's macroeconomic resilience and global competitiveness requires an understanding of the dynamics of trade openness and external balances. India's transformation from a closed economy before the 1990s to a fairly open and internationally interconnected economy by the 2020s has significant ramifications for its external sustainability and trade patterns. In order to determine relative trade competitiveness and external sector stability, this section compares India's performance with peer groups—ASEAN, BRICS, Advanced Economies, Emerging Economies, and Low-Income Countries—in terms of exports, imports, and the current account balance (as a percentage of GDP) over the 1980–2025 period.
India's average imports (7.50% of GDP) and exports (8.02% of GDP) are higher than those of advanced, emerging, and ASEAN countries, indicating a strengthening of trade integration after the 1990s liberalization changes. India, on the other hand, has the worst current account balance (-5.7%), which indicates ongoing foreign deficits, especially since 2008.
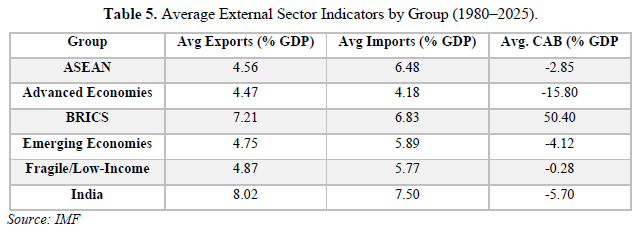
Significant CAB deficiencies demonstrate how India's external vulnerability coexists with its comparatively high openness as presented in Table 5. In order to manage import dependency, particularly in energy and capital goods, and increase export competitiveness, a balanced trade policy is required. Conversely, resource-rich economies with robust export surpluses, like Russia, are in the forefront of the BRICS countries' robust external surplus (avg. CAB = +50.4%). Compared to India, ASEAN nations exhibit superior external balance sustainability despite having modest trade deficits. Though these are usually counterbalanced by capital inflows and more robust financial systems, advanced economies surprisingly post substantial negative CAB values.
Phase-Wise Group Comparison of External Sector Performance
Assessing macroeconomic resilience and competitiveness requires an understanding of how trade flows and external balances have changed over time. Using three different policy stages, we compare the external sector performance of India with that of the key country groups, namely ASEAN, BRICS, Advanced Economies, Emerging Economies, and Fragile/Low-Income Economies:
This comparison sheds light on how India’s trade dynamics have shifted in response to global and domestic structural changes.
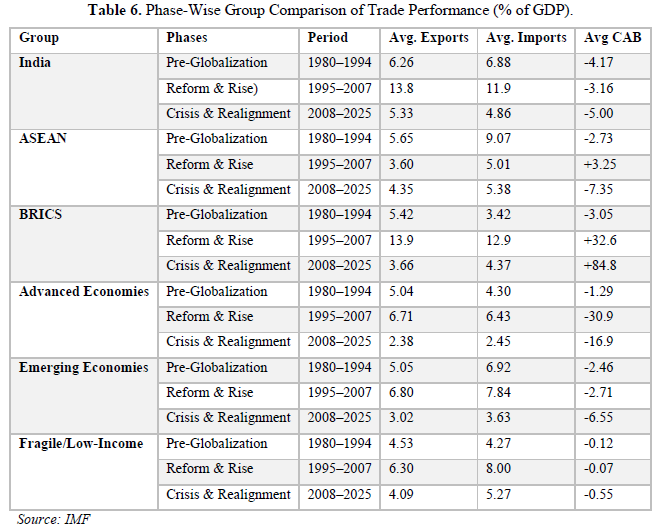
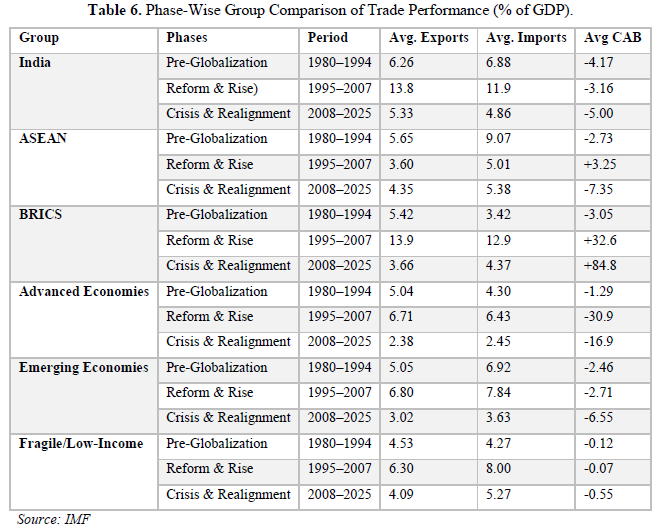
A comparative analysis of external sector performance over three different economic phases—pre-globalization (1980–1994), reform rise (1995–2007), and crisis realignment (2008–2025)—is presented in Table 6 for the major country groups of India, ASEAN, BRICS, advanced economies, emerging economies, and fragile/low-income economies. Significant changes in trade competitiveness and current account dynamics over time are highlighted by the analysis.
During the Reform & Rise phase, India's trade profile experienced a significant shift, with average imports and exports reaching 11.9% and 13.8% of GDP, respectively, up from just 6.88% and 6.26% in the pre-globalization era. This illustrates the powerful effects of growing global integration and economic liberalization. But during the Crisis & Realignment phase (2008–2025), India's trade openness significantly shrank, with imports and exports dropping to 4.86% and 5.33% of GDP, respectively, and the current account balance sharply worsening to an average of –5% of GDP. This atypically high number most likely indicates methodological problems or structural changes, such as growing energy import costs, ongoing deficits, and gaps in global demand.
With a current account balance of +84.8%, the BRICS economies, on the other hand, maintained a robust surplus despite a decline in trade ratios after 2008. This surplus was probably driven by commodity exports and favorable terms of trade. After establishing surpluses throughout the Reform & Rise period, ASEAN countries displayed moderate deficits in the most recent phase (-7.35%). Throughout all three decades, advanced economies saw a decline in trade flows and ongoing deficits, especially during the Reform phase (-30.9%). While fragile/low-income economies showed relatively balanced trade flows and minor deficits, indicating less integration but also more macroeconomic stability, emerging economies followed a similar trajectory.
All things considered; Table 6 shows how India's external sector opened up throughout the reform era but found it difficult to sustain this pace in the face of international challenges following the crisis. Other nation groups, particularly BRICS, showed more tenacity in preserving trade surpluses in comparison, underscoring disparities in trade competitiveness and structural external balance performance.
Empirical Analysis of Trade Integration and External Sector Trends
The empirical results of a panel data regression analysis evaluating the evolution of India's external sector indicators across three major global phases—Pre-Globalization (1980–1994), Reform and Rise (1995–2007), and Crisis and Realignment (2008–2025)—are presented in this section. The analysis compares India to key global country groups, including BRICS, ASEAN, Advanced Economies, Emerging Economies, and Fragile or Low-Income Economies.
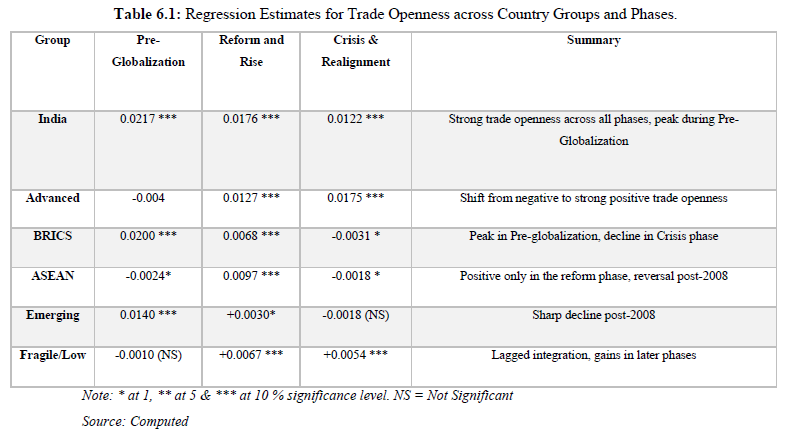
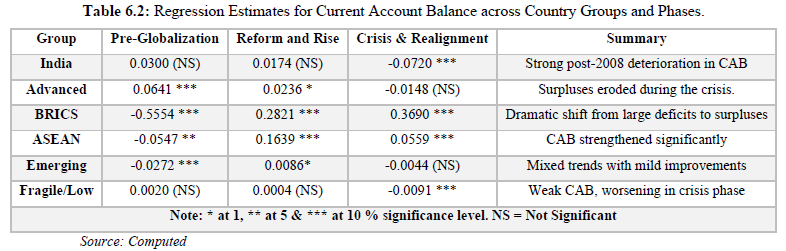
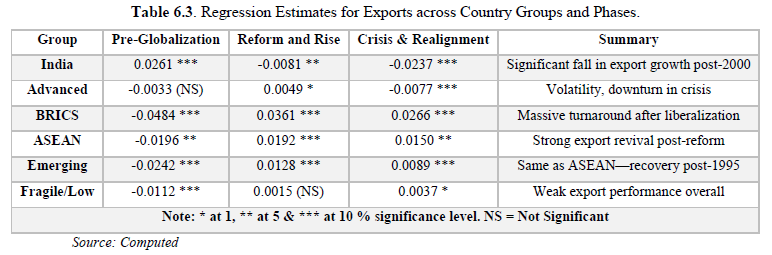
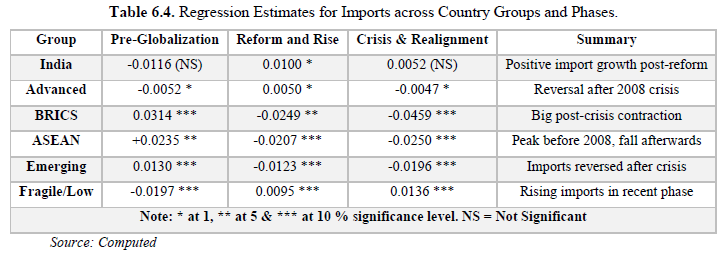
Four main variables—all stated as a percentage of GDP—are the subject of the analysis: imports, exports, current account balance (CAB), and trade openness. With India as the focal point of this comparative framework, we can see how its external sector trajectory either follows or deviates from global trends. Four main tables—Table 6.1 (Trade Openness), Table 6.2 (CAB), Table 6.3 (Exports), and Table 6.4 (Imports)—provide specifics on the findings.
(a). Trade Openness
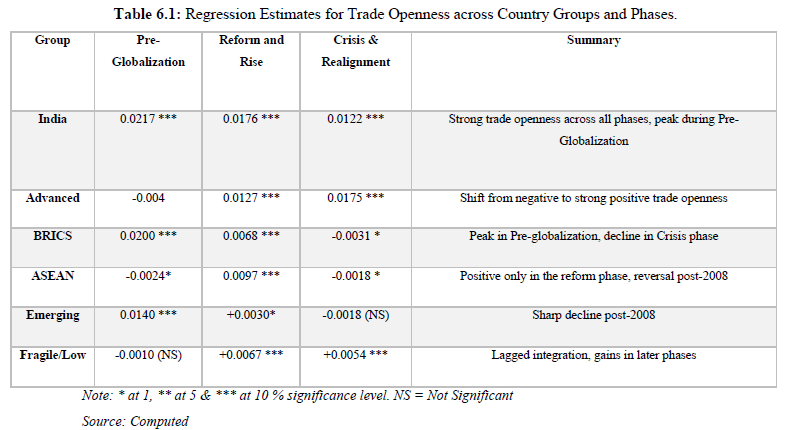
Throughout all three periods, India's trade openness remained continuously high and statistically significant, with the pre-globalization phase showing the highest coefficient (+0.0217***). This demonstrates India's early and resolute efforts to liberalize commerce, even prior to the economic reforms of 1991. Other groups, however, exhibit more erratic patterns. In the years following 1995, advanced economies shifted from a somewhat negative trade position in the 1980s to a strong positive openness. Prior to 1995, the BRICS nations were very open, but during the crisis phase, they showed a discernible dip (-0.0031), suggesting a potential retreat from globalization. During the Reform and Rise phase, ASEAN economies showed substantial positive integration; however, during the crisis years, they deteriorated marginally. Following 2008, emerging economies showed a dramatic decline in trade integration. Although their average levels remained low, trade openness in fragile and low-income economies showed a slight improvement after 1995. Therefore, India is unique in that it has maintained consistent trade integration during all global phases, whereas many other nation groupings have fluctuated or slowed considerably, especially after 2008.
(b). Current Account Balance
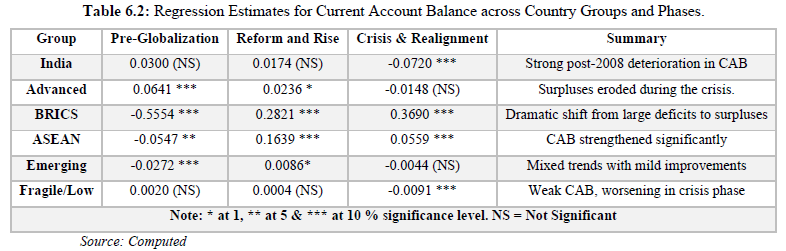
During the Crisis and Realignment period, India's Current Account Balance (CAB) experienced a dramatic and alarming reversal, with a coefficient of -0.0720***, signifying growing deficits. India's CAB was statistically negligible but somewhat positive during the initial stages, indicating a comparatively steady external position before the world shocks. This decline since 2008 is a result of imbalances brought about by India's sluggish exports and increasing import intensity.
On the other hand, the CAB positions of ASEAN and BRICS nations have significantly improved over time. ASEAN improved from -0.0547** to +0.0559***, while BRICS went from a severe deficit (-0.5554***) to notable surpluses (+0.3690*** throughout the crisis period). During the global financial crisis, advanced economies experienced a downturn after maintaining surpluses in the early years. While fragile economies had balances that were weak or statistically insignificant, with a minor fall after 2008, emerging economies showed only modest increases. India's decline in the CAB, especially during the global crisis, stands in stark contrast to the constructive rebalancing that ASEAN and BRICS have accomplished, indicating a lost chance for systemic change.
(c). Exports
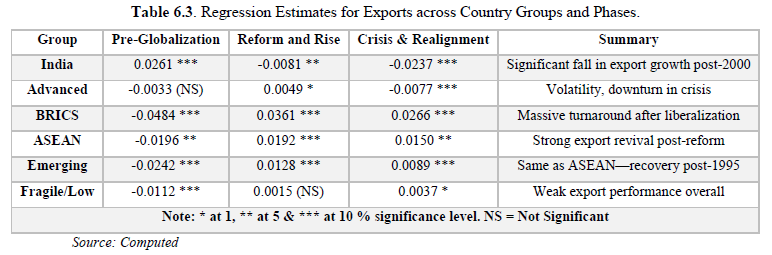
With a strong positive coefficient in the pre-globalization phase (+0.0261***) and a negative and considerable shift in the reform and crisis periods (-0.0081** and -0.0237***, respectively), India's export performance shows a definite downward trend. This trend illustrates India's waning export competitiveness and excessive dependence on domestic demand in the years following reform, particularly after 2008.
The BRICS economies, on the other hand, had a sharp recovery, going from a notable export decline during the pre-globalization era (-0.0484***) to robust export expansion during the reform (+0.0361***) and crisis (+0.0266***) eras. In a similar vein, ASEAN nations had steady increases in exports following 1995, and emerging economies continued to drive exports during the final two stages. With the exception of a few post-crisis advances, fragile economies saw weak or statistically negligible export growth, while advanced economies displayed small and cyclical export variation. These findings demonstrate India's distinctive difference in that it started with a robust export base but was unable to maintain or grow it, particularly during a time when the export profiles of its comparative nations improved.
(d). Imports
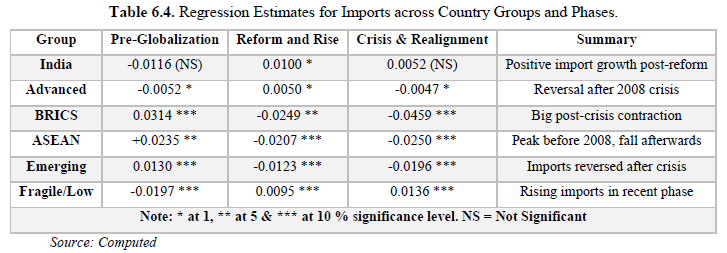
Over time, India's import trajectory shows a consistent and troubling rise. Imports were marginally negative (-0.0116 [NS]) during the pre-globalization phase, but they became positive and statistically significant during the reform phase (+0.0100), and they continued to do so throughout the crisis period (+0.0052 [NS]). One of the main causes of India's decreasing CAB has been this mismatch between imports and exports.
On the other hand, the economies of ASEAN and BRICS successfully modified their import policies in reaction to outside shocks. During the crisis era, ASEAN's import coefficients went from +0.0235** to -0.0250***, while BRICSs decreased from +0.0314*** to -0.0459***. Their current accounts were stabilized as a result of these changes. Similar trends were seen in emerging economies, whose import coefficients sharply declined after the crisis. As a result of demand compression and rebalancing, advanced economies also decreased imports after 2008. Nonetheless, in the post-crisis period, fragile economies continued to exhibit increasing imports, presumably due to reliance on food and fuel. Particularly when compared to comparator groups who implemented remedial measures to rebalance their trade flows, India's unbalanced trend of increasing imports and declining exports over the post-reform and post-crisis years is notable and worrisome.
Several important insights on the success of India's foreign sector are highlighted by the regression findings. Throughout all eras, India maintained a considerable level of integration with the world trading system; yet, this openness was not matched by steady export growth or balanced external accounts. After the global financial crisis, BRICS and ASEAN nations successfully reformed their external sectors, but India's current account deficit widened as a result of its stagnant exports and ongoing import increases. These findings imply that in order to maintain external sustainability in a changing global context, India's policy priority now needs to shift towards export diversification, value addition, and lowering structural import dependency.
Examine Capital Flows and Fiscal Position
This section looks at how capital flows and fiscal dynamics changed between 1980 and 2025 in four different country groups: India, Fragile/Low-Income Economies, Emerging Markets, and Advanced Economies as presented in Table 7. The goal is to evaluate the changes in patterns of debt accumulation, savings-investment dynamics, foreign direct investment, and fiscal balances over the course of the three main stages of global economic transformation: pre-globalization (1980–1994), reform and rise (1995–2007), and crisis & realignment (2008–2025). The analysis seeks to find fundamental differences in external financing strategies, fiscal sustainability, and integration into the global economy by breaking down important macro-fiscal metrics and capital inflow trends across various groupings and phases. As an example of a sizable emerging economy going through a gradual liberalization process, India is examined individually.
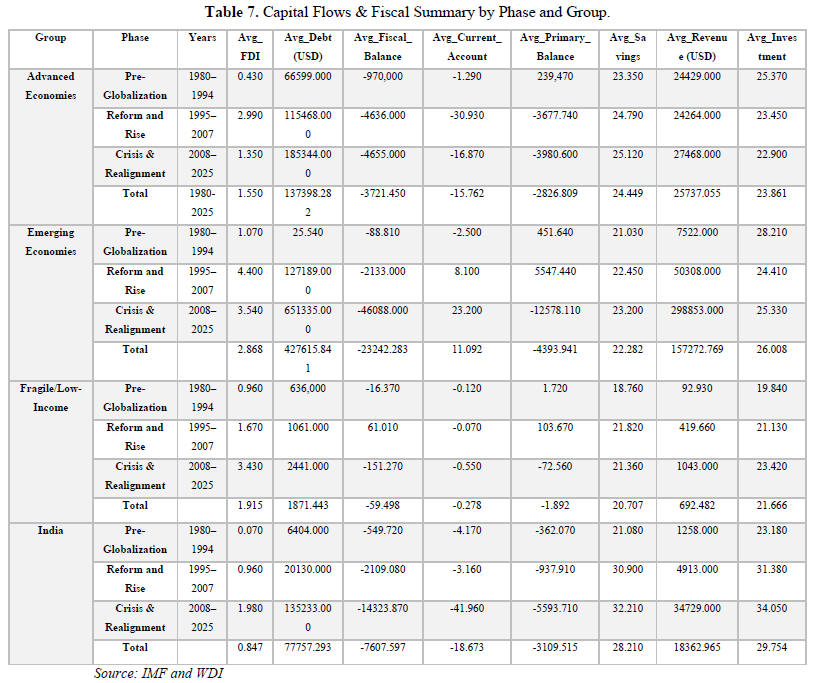
A thorough summary of the changes in capital flows and fiscal indicators for the four country groups of advanced economies, emerging economies, fragile/low-income economies, and India from 1980 to 2025 is given in Table 5. In addition to aggregated averages for the full time, the data is offered throughout three important economic phases: pre-globalization (1980–1994), reform and rise (1995–2007), and crisis & realignment (2008–2025).
Advanced Economies
Across all phases, advanced economies exhibit a noticeable shift in capital inflows and fiscal health. These economies had moderate debt levels (about 66,599) and relatively modest foreign direct investment (FDI) inflows (0.43% of GDP) during the pre-globalization era. However, FDI nearly doubled during the Reform and Rise phase (2.99% of GDP), indicating increased global capital mobility and openness. Fiscal deficits expanded dramatically (−4,636), and average debt climbed greatly to 115,468 at the same time, suggesting a relaxing of fiscal positions amid economic integration and prosperity.
Average FDI decreased little (to 1.35 percent of GDP) during the Crisis & Realignment phase (after 2008), but debt increased even more to 185,344, highlighting the effects of fiscal stimulus and bailouts in reaction to international crises. Primary balances and current account positions kept getting worse even as revenue increased (avg. 27,468). According to the full-period averages, advanced economies experienced ongoing fiscal challenges, particularly after 2008, even if they were able to draw significant capital over time.
Emerging Economies
Emerging economies exhibit a unique path marked by a swift escalation in both fiscal expansion and external integration. During the Reform and Rise period, which coincided with trade liberalization, privatization, and increased openness, FDI inflows increased from 1.07% of GDP in the pre-globalization era to 4.40%. The post-2008 period (Crisis & Realignment) demonstrates a slight decline in foreign direct investment (3.54%), but a sharp increase in the national debt (average of almost 651,000) and ongoing capital inflows, including investment that averages 25.33% of GDP.
Notably, in contrast to advanced economies, emerging economies maintained positive and growing current account balances (from -2.5 percent to +23.2 percent), particularly after 2008. This was partially due to increased export-driven development and competitiveness. These nations effectively used capital inflows to fund infrastructure construction and growth, but at the expense of growing debt and fiscal weaknesses, as the total-period summary attests.
Fragile/Low-Income Economies
Low base levels and lengthier transitions are characteristics of the fiscal and capital flow patterns in fragile/low-income economies. Although absolute numbers are still low, FDI inflows rose slightly from 0.96% in the early period to 3.43% in the post-2008 era. Current account balances stayed close to zero during all phases, and debt levels increased steadily from 636 to 2,441, suggesting little external financing and integration.
It is interesting to note that these economies saw a rare positive fiscal outcome during the Reform and Rise phase (+103.67 primary balance and +61.01 fiscal balance), which may have been brought on by assistance inflows or debt reduction initiatives. However, financial stress reappeared during the Crisis & Realignment phase. The average fiscal and current account balances for the entire period stayed marginally negative, indicating the need for focused institutional support and the precariousness of their macroeconomic stability.
India
India's development provides a mixed path that demonstrates how its 1991 reforms had a profound impact. Before globalization, FDI inflows were almost insignificant (0.07% of GDP). By the Reform and Rise phase, they had more than tenfold grown (0.96%), and during the Crisis & Realignment phase, they had doubled (1.98%). From 6,404 prior to reform to over 135,000 in the most recent period, debt levels rose sharply in tandem with increased public spending and infrastructure development. With fiscal deficits averaging −14,324 and current account deficits deteriorating to −41.96% of GDP—by far the highest among peer groups—India's fiscal health deteriorated significantly in the post-2008 period, illustrating the twin deficit crisis. However, the dataset's greatest levels of savings (32.21% of GDP) and investment (34.05% of GDP) indicate robust domestic economic activity and capital formation.
In terms of FDI inflows and capital formation, emerging economies routinely beat others, while advanced economies see a decline in investment shares in spite of increased revenue and savings. All categories—with the exception of fragile economies in the middle phase—show increasing public debt and fiscal deficits over time, with emerging economies and India showing the most volatility after 2008. Emerging economies significantly improve their current account conditions, while advanced and fragile economies tend to deteriorate them. India is still struggling with a growing foreign deficit in spite of its reform successes.
Panel Regression Estimates of GDP Growth, Trade Openness, and Fiscal Balance across Country Groups and Phases (1980–2025)
The findings of three panel regression models that look at the differences in macroeconomic outcomes (GDP growth, trade openness, and fiscal balance) between international country groups and different structural stages between 1980 and 2025 are shown in Table 8. In order to investigate how these factors vary across time and space as well as how specific combinations of historical period and country type influence macroeconomic trajectories, each model includes both group and phase indicators along with their interaction terms. During the post-2008 crisis and realignment phase, advanced economies are the reference group for all comparisons.
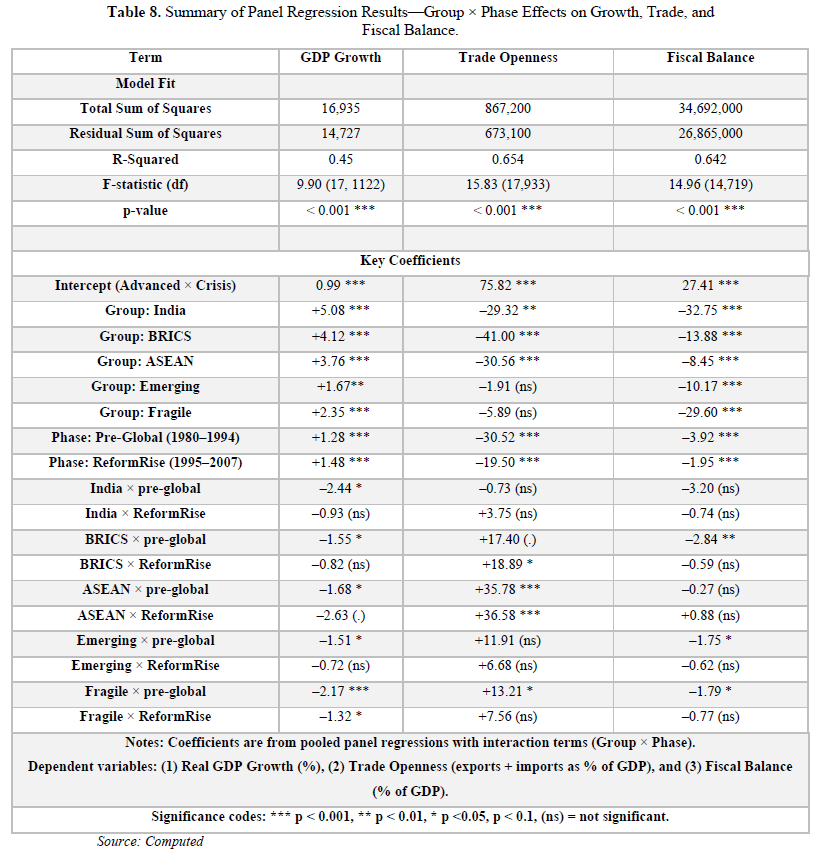
Approximately 45% of the variance in GDP growth may be explained by the regression model. The findings show that throughout the reference period, India's economic growth was noticeably faster than that of advanced economies. In comparison to established economies, other groups like ASEAN and BRICS also saw faster growth rates. These variations fit the larger story of emerging market convergence during the liberalization decades and are statistically significant at the 1 percent level. When compared to the post-2008 period, the Reform and Rise phase (1995–2007) is linked to a considerable acceleration in GDP growth throughout the sample, demonstrating a statistically significant positive effect at the 1 percent level. In comparison, there is only a slight growth during the Pre-Globalization era (1980–1994). India's advantage was more concentrated in the post-2008 timeframe, with smaller or statistically negligible improvements during prior eras, according to the interaction terms. This lends credence to the idea that India's economy accelerated over the next few decades rather than immediately after the 1991 reforms.
Even more pronounced differences between groups and phases are shown by the trade openness model, which accounts for more than 65 percent of the observed variation. The highest average trade openness was maintained by advanced economies during the Crisis and Realignment period. On the other hand, during the same time period, ASEAN, BRICS, and India had significantly smaller trade shares in relation to GDP. Both the 1 percent and 5 percent levels of statistical significance are reached by these differences. But over time, some areas saw significant improvements. Trade openness increased statistically significantly throughout the Reform and Rise period, especially for ASEAN nations, which saw sharp gains in both the baseline and interaction terms. This is consistent with East Asia's regional production integration in the 1990s and early 2000s. Although India's trade openness rose throughout the Reform and Rise phase as well, this difference is not statistically significant, indicating a more gradual or cautious approach to joining international trade networks. A certain amount of catch-up is indicated by the moderately positive and statistically significant interaction effects for BRICS at the 10-percent level. Although the degree of integration varied greatly by location, the aggregate results support the notion that the post-1995 period was a defining moment for trade liberalization internationally.
The fiscal balance model shows consistent fiscal deficits in emerging and developing nations and accounts for about 64% of the data volatility. At the 1 percent threshold, there was a statistically significant difference between India's fiscal balance and that of advanced nations. Comparable trends are noted for the Emerging, BRICS, and Fragile categories. To a lesser degree, ASEAN nations' budgetary balances were worse than those of the advanced group. Fiscal balance deterioration is linked to both the Pre-Globalization and Reform and Rise periods, and these effects are statistically significant. The fiscal regression's interaction variables, however, are largely statistically unimportant in contrast to the GDP and trade models. This implies that fiscal pressures have stayed strong across all phases and are less susceptible to shifts in the global economy than trade or growth results. The results support the literature's worries about structural deficits, inflexible spending patterns, and emerging and lower-income nations' limited ability to mobilize revenue.
In conclusion, Table 8 highlights the many economic development trajectories during the previous forty years. Even though GDP growth and trade openness have significantly improved in India and other rising nations, they still face formidable budgetary obstacles. Although trade liberalization and economic dynamism marked a significant turning point during the Reform and Rise era, improvements in fiscal balance did not coincide with this period. These results emphasize the necessity of integrated policy frameworks that combine fiscal sustainability with the promotion of growth and trade, particularly in a global setting marked by financial volatility and frequent external shocks.
DISCUSSION
Over the past forty years, India's macroeconomic path has been characterized by a number of structural changes brought about by internal realignments, policy reforms, and global integration. The study's empirical findings, which were derived using a thorough panel regression framework with Group × Phase interactions, highlight how complex India's change is. The findings from the three main goals—growth trajectory, trade integration, and fiscal-capital flows—are summarized in this part, which also places India in relation to other country groups such as ASEAN, BRICS, and the Emerging, Fragile, and Advanced economies.
India’s Growth Trajectory: Divergence, Delays, and Resilience
India has continuously outpaced advanced nations in terms of GDP growth, according to the data, with a statistically significant advantage during the Reform and Rise phase that followed 1991 and the Crisis and Realignment phase that followed. However, this growth advantage was not instantaneous, as the interaction terms show. Despite being frequently seen as a watershed event, the structural reforms of 1991 appear to have had a modest and delayed impact, with the largest growth divergence occurring between 2008 and 2025.
India's distinct structural makeup is reflected in this pattern. India's path avoided extensive industrialization and instead moved toward a services-led economy, in contrast to traditional development models that propose a step-by-step transition from agriculture to industry and finally services (Lewis, 1954; Kuznets, 1971). This method has facilitated rapid GDP expansion, but it has not always resulted in inclusive employment generation or sectoral balance, as noted in the literature (Kalaiyarasan, 2022; Roy Bardhan & Sarkar, 2024). Even while India's growth was significant, it was still driven by consumption and centered in industries like banking and information technology, unlike ASEAN, which benefited from export-led industrialization. These findings are supported by the panel regression, which shows that while ASEAN and BRICS are outperforming advanced economies, they are not continuously outpacing India's long-term economic pace.
Trade Integration: Incremental Openness, Uneven Gains
A more nuanced picture is revealed by India's commercial integration. Even while trade openness increased globally throughout the Reform and Rise phase, particularly for ASEAN and BRICS, the results indicate that India's gain in trade openness was not statistically significant when compared to the advanced group baseline, despite being directionally favorable. In contrast, ASEAN had a sharp rise in trade openness, especially between 1995 and 2007, as a result of its manufacturing exports and extensive integration into global value chains.
There are several reasons why India's trade performance has been comparatively modest. First, earnings from exporting goods were constrained by the service-oriented growth paradigm. Second, India still faced structural constraints like poor logistics, convoluted regulatory frameworks, and volatile currency rate regimes in spite of tariff reductions and liberalization initiatives. The empirical results are consistent with earlier research (Ghosh, 2020; IMF, 2018), which highlights a conflict between successful integration into international trade networks and policy liberalization. Furthermore, it appears that trade liberalization plateaued following the first reform surge, with protectionist attitudes and global headwinds reducing benefits throughout the Crisis and Realignment period. This is supported by the lack of significant interaction effects in the post-2008 phase.
Fiscal Position and Capital Flows: Persistent Vulnerabilities
One of the most obvious differences between India and its peer groups may be seen in the fiscal balance study. Throughout all periods, India's budget deficits were much higher than those of advanced nations, and neither the Reform and Rise nor the post-2008 periods saw any appreciable reduction. The findings highlight systemic flaws in the management of public finances, such as a small tax base, a heavy reliance on subsidies, and the sluggish adoption of laws promoting fiscal prudence.
The idea that high-growth emerging economies frequently experience fiscal asymmetries is supported by the interesting fact that the fiscal performance of the BRICS and fragile economies also stayed continuously poor (Akber, Paltasingh, & Mishra, 2022). Although not completely impervious, ASEAN economies showed comparatively superior fiscal management. The fiscal model's absence of statistically significant interaction terms indicates that reforms have not significantly changed India's or its emerging market counterparts' fiscal trajectories. This lends credence to the idea that India's macroeconomic change has been driven by growth rather than fiscal consolidation, with significant deficits continuing to exist even as the economy has expanded.
Furthermore, the larger body of research indicates that fiscal imbalances can erode investor confidence and leave countries vulnerable to external shocks, even though capital inflows like foreign direct investment (FDI) are not the subject of this panel model. As stressed by international organizations and earlier research, India's experience in the post-2008 era—characterized by growing debt, current account vulnerabilities, and exchange rate pressures—further supports the need for structural reforms in public finance (Bhattacharjee & Das, 2023; OECD, 2024).
India in Comparative Context: Hybrid Trajectory Amid Structural Divergence
A unique pattern is shown when the outcomes of the three objectives are combined. India has partially converged in trade openness, clearly deviated from advanced economies in terms of growth performance, and is still far behind in terms of fiscal consolidation. In terms of economic indicators, India performs better than the BRICS and fragile economies among its peer groupings, but it trails ASEAN in terms of trade performance and public finance discipline.
India's economic potential and structural limitations are both reflected in this mixed trajectory. The results support the claims made by Kalaiyarasan (2022) and Das (2025) that India's growth story is one of gradual but steady progress, propelled primarily by domestic consumption and less by fiscal strength or export competitiveness. The data also backs up policy viewpoints that advocate for formalizing the tax code, increasing public investment in infrastructure and human capital, and diversifying trade.
Although its GDP growth did not continuously surpass India's, ASEAN stands out as the group that most successfully converted global economic changes into trade and fiscal advantages when viewed in a comparative manner. In contrast, BRICS shares India's experience in terms of trade and fiscal policies, albeit with slower average growth. While emerging markets show a range of results depending on institutional strength and domestic policy decisions, fragile economies continue to lag behind on all metrics.
CONCLUSION
India's macroeconomic trajectory during the last forty years demonstrates a nuanced combination of structural imbalance and resiliency. The nation's trajectory is still different from that of its advanced and emerging peers, despite the fact that it has moved from an inward-looking, agrarian economy to a service-led economic model that is intricately linked with global capital and trade flows. Three distinct phases emerge from the analysis: the Pre-Globalization period (1980–1994), which saw slow growth and isolation; the Reform and Rise phase (1995–2007), which saw rapid transformation; and the Crisis and Realignment phase (2008–2025), which saw increased instability and a need to reevaluate policies.
High levels of domestic investment, comparatively low inflation, and rapid growth driven by services are India's competitive advantages. Its underdeveloped industrial sector, growing fiscal vulnerabilities, and ongoing current account deficits, however, draw attention to fundamental weaknesses. India has had difficulty converting openness into long-term external sustainability, in contrast to the economies of the BRICS and ASEAN, which have maintained export competitiveness and adjusted external balances.
The policy implications are obvious: India has to strengthen its industrial base, encourage productivity-driven employment, and lessen its reliance on imported capital goods and energy in order to rebalance its macroeconomic architecture. Infrastructure and capacity-building should be the focus of fiscal policy instead than consumption subsidies. Furthermore, it would be crucial to revive export industries through focused incentives and regional trade plans. India's competitiveness in the future will rely on structural changes that balance growth with inclusion and macroeconomic stability as global commerce grows more fragmented and capital flows become more unpredictable.
FINANCIAL STATEMENT
This research did not receive any specific grant from funding agencies in the public, commercial, or not-for-profit sectors. All expenses related to data acquisition, analysis, and manuscript preparation were personally borne by the author.
CONFLICT OF INTEREST STATEMENT
The author declares no conflict of interest in the conduct of this research or the preparation of this manuscript.


Economic liberalization in India. (n.d.). In Encyclopedia Britannica. Retrieved June 2025, from https://www.britannica.com/place/India/Economic-liberalization
Institute for Studies in Industrial Development. (2023). Revitalizing India’s industrial strategy: MSMEs and value chains. ISID Working Paper Series.
International Monetary Fund. (2018). India: Selected issues (IMF Country Report No. 18/255). DOI:https://doi.org/10.5089/9781484373200.002
International Monetary Fund. (2024). India’s reform scorecard: Trade, capital, and fiscal sustainability. IMF Policy Paper. https://www.imf.org/en/Publications/Policy-Papers
Organisation for Economic Co-operation and Development. (2024). India: Economic outlook and structural reform agenda. https://www.oecd.org/india/indias-economic-outlook/
No Files Found


Internationally Accepted
Share Your Publication :