
-
Publish Your Research/Review Articles in our High Quality Journal for just USD $99*+Taxes( *T&C Apply)
Offer Ends On
Publish Your Research/Review Articles in our High Quality Journal for just USD $99*+Taxes( *T&C Apply)
Offer Ends On
Arvind Kumar Tripathi*, Ajay Kumar Pathak, Pragati Awasthi, Vandana Tiwari1 and Smriti Shukla
Corresponding Author: Arvind K Tripathi, Centre for Biotechnology Studies, APS University, Rewa, M.P, India
Received: December 29, 2021 ; Revised: February 14, 2022 ; Accepted: February 17, 2022
Citation: Tripathi AK, Pathak AK, Awasthi P, Tiwari V & Shukla S. (2022) Association Study of PPARG2 Gene Polymorphism with Diabetes in Vidhyan Population of Madhya Pradesh, India. J Gene Cell Mol Biol, 1(1): 1-9.
Copyrights: ©2022 Tripathi AK, Pathak AK, Awasthi P, Tiwari V & Shukla S. This is an open-access article distributed under the terms of the Creative Commons Attribution License, which permits unrestricted use, distribution, and reproduction in any medium, provided the original author and source are credited.
Views & Citations
Likes & Shares
Abstract
Type 2 diabetes mellitus (T2DM) is a complex disease caused by the interaction between genetic and environmental factors. A growing number of evidence suggests that the peroxisome proliferator activated receptor gamma (PPARG) gene plays a major role in T2DM development. The analysis of genetic association studies is an efficient tool to gain a better understanding of multifactorial diseases and potentially to provide valuable insights into gene-disease interactions. The PPARG2 gene abundantly expressed in adipose tissue has several variants, one of the most common (minor allele frequency of 10% in Caucasians) is the Pro12Ala substitution at codon 12 in PPARG2. This polymorphism has been shown to be associated with reduced ability to Trans-activate responsive promoters and thus with lower PPARG2 transcriptional activity. The biochemical parameters related to obesity. We found BMI in female (0.0388*) and WHR (P<0.0001***) having strong correlation to obesity. Biochemical parameter FP (mg/dL) (P<0.0001***), Post-Prandial Glucose (mg/Dl) (P<0.0001***) were significantly associated to obesity. Gene PPARG2 having G and A alleles. The genotypic distribution of AA, AG is more than AA where p value is 7.253, (0.0266*). The allelic frequency of A is high in comparison to G alleles where p value is 6.684, (0.0097**) thus the carriage rate of A allele is high in comparison to G allele.
Keywords: PPARG2 gene, T2DM, Allele, Genotype frequency and p value
INTRODUCTION
Type 2 Diabetes is highly prevalent in India. Several studies on Asian Indians have shown that they are characterized by higher insulin resistance, early onset type 2 diabetes and hypertension. For a given BMI Indians have a higher percentage of body fat and more visceral fat than members of other population [1]. The tendency of Indians to have higher percentage of body fat and central adiposity compared with other races may be programmed in uteri. This thin fat phenotype is present at birth. Small size at birth coupled with subsequent obesity increases risk for insulin resistance syndrome in later life. Dietary modifications play an important role in initiation of insulin resistance syndrome. This may also lead to Type 2 diabetes in Indian population [2,3]. The oil preferred for cooking India is considerably changes the ratio of W6/W3 fatty acids. A number of free fatty acids are PPARg activators. When individual with thrifty genotype is supplied energy rich food with reduction in physical activity there will be a greater prevalence of obesity, impaired glucose tolerance and type2 diabetes. PPARg activation enhances adipocyte differentiation make the people more obese [4]. PPARg coordinates the thrifty response and urges the need for studying PPARg in Indians. Because this could explain the heterogeneity of insulin resistance and type 2 diabetes in Indians. Aim of this study is to find out PPARg polymorphisms and their association with type 2 diabetes in south Indian population. Peroxisome proliferator activated receptors constitute a distinct sub family of the nuclear receptors that are activated by naturally occurring fatty acids [5,6].
Three subtypes of PPARS have been identified. PPARα., PPARβ, PPARγ. PPAR subfamily is involved in many cellular processes including lipid and glucose homeostasis, cellular proliferation, differentiation and control of inflammation. PPARg is located on chromosome [7-10]. PPARg has two isoforms. They are a result of alternative mRNA splicing. PPARg1 is expressed in most tissues. PPARg 2 is specific for adipose tissue [11]. When PPARg binds to a natural ligand or synthetic molecule such as thiazolidinedione, it becomes activated and complexes with another transcription factor known as retinoid X receptor (RXR). PPAR-RXR heterodimers bind to DNA motifs termed as Peroxisome proliferative response elements (PPRES) in the promoters of target genes [8,12]. The whole PPRE consensus sequence exhibits a pattern specific for PPAR-RXR heterodimer and is indistinguishable from the responsive elements of other nuclear hormone receptors belonging to oestrogen, vitaminD of thyroid hormone. The functional PPRES have been identified in several adipocyte specific genes such as phosphoenol pyruvate carboxykinase, fatty acyl synthase, fatty acid transport protein, lipoprotein lipase, glucokinase, GLUT4 glucose transporter. Insulin resistance likely to occur when excess fat is deposited within the abdominal cavity [13-18]. This reduces the insulin sensitivity of fat cell also of other tissues including skeletal muscle and liver. Expanding adipose stores alter the availability of free fatty acids and modify the PPAR ligand binding interaction. PPARg is considered to be a candidate gene for type 2 diabetes. Because it is involved in adipocyte differentiation and lipid storage, it makes the person obese [19-22].
MATERIALS & METHODS
Study Population
The study population consisted of 400 unrelated subjects comprising of 190 T2D patients and 210 ethnically matched controls of central Indian population were included in this study. In this region Hindu, Muslim and some Sikh peoples are mainly living but most people belong to Hindu religion in this region. Cases included consecutive patients who attended the Department of Medicine, Shyam Shah Medical College and Sanjay Gandhi Memorial Hospital, Rewa, Ayurveda Medical College, Rewa, Ranbaxy pathology regional collection center Rewa, District hospital Satna, Shahdol, Sidhi.
Anthropometric and Biochemical Measurements
Anthropometry:
Height and Weight were measured in light clothes and without shoes in standing position as per standard guidelines. Body Mass Index (BMI) was calculated as weight in kilograms divided by height in meters squared. Waist circumference was measured in standing position midway between iliac crest and lower costal margin and hip circumference was measured at its maximum waist to hip ratio (WHR) was calculated using waist and hip circumferences. Systolic and diastolic blood pressures were measured twice in the right arm in sitting position after resting for at least 5 minutes using a standard sphygmomanometer and the average of the two reading was used.
Biochemical Analysis:
Biochemical parameters related to type 2 diabetes were estimated for both cases and controls subjects. Measurement of Serum levels of Total cholesterol (TC), Triglycerides (TG), HbA1c, High density lipoprotein-cholesterol (HDL-C), Low density lipoprotein-cholesterol (LDL-C), Urea, Uric acid, C-reactive protein (CRP) and Creatinine were measured based on spectrophotometric method using automated clinical chemistry analyzer Cobas Integra 400 plus (Roche Diagnostics, Mannheim, Germany).
Blood collection and Plasma/Serum Separation:
Venous blood samples were obtained from the subjects after 12 h of overnight fasting in vacutainers with and without appropriate anti-coagulants. Immediately, plasma and serum from the respective vacutainers were separated by centrifuging the tubes at 1000 rpm for 10 min at 4°C.
Method for DNA isolation
Genomic DNA was extracted from whole blood by the modification of salting out procedure described by Miller and coworkers. Frozen blood sample was thawed at room temperature. 0.5 ml. of whole blood sample was suspended in 1.0 ml. of lysis buffer (0.32 M Sucrose, 1 mM Mgcl2, 12 mM Tris and 1% Triton-X-100) in a 1.5 ml. microcentrifuge tubes. This mixture was mixed gently by inverting the tube upside down for 1 min. The mixture was then allowed to stand for 10 min at room temperature to ensure proper lysis of cells. The mixture was centrifuged at 11,000 rpm for 5 min at 4°C to pellet the nuclei. The supernatant was discarded carefully in a jar containing disinfectant, as pellet formed is loosely adhered to the bottom of centrifuge tube. The pellet was resuspended in 0.2 ml. of lysis buffer and recentrifuged at 11,000 rpm for 5 min. The pellet was than dissolved in 0.2 ml. of deionized autoclaved water and mixed thoroughly on vortexer. The mixture was centrifuged at 14,000 rpm for 1 min at 4°C. Supernatant was discarded to gain an intact pellet. To the above pellet, 80 μl. of proteinase K buffer (0.375 M NaCl, 0.12 M EDTA, pH 8.0) and 10 μl. of 10% SDS (10% w/v SDS, pH 7.2) was added. Mixture was well frothed with the help of micro tip to allow proper lysis of pelleted nuclei. After digestion was complete, 100 μl. of saturated cold 5M NaCl was added and shaken vigorously for 15 sec. To the above mixture 0.2 ml. of deionized, autoclaved water and 0.4 ml. of phenol-chloroform (4:1 v/v) was added to remove most of the non-nucleic acid organic molecules. Microcentrifuge tube was inverted upside down until the solution turned milky. Phases were separated by centrifuging the above mixture at 12,000 rpm for 10 min at 4°C. Aqueous (top) layer was saved and transferred in another microcentrifuge tube. Transferring of any interface layer was avoided. To the aqueous layer, 1 ml. chilled absolute ethanol was added and the tube was inverted several times until the DNA precipitated. DNA precipitates like thread. This was centrifuged at 14,000 rpm for 4 min at 4°C to pellet the DNA thread. Supernatant was discarded. The pellet was washed twice with 1 ml. of 70% alcohol. The mixture was again centrifuged at 14,000 rpm for 1 min 4°C. Supernatant was discarded and pellet was air dried for 10-20 min. The pelleted DNA was rehydrated in 100-200 μl. of TE buffer pH 7.4 (10 mM Tris-HCL pH 7.4, 1mM EDTA, pH 8.0). DNA was allowed to dissolve overnight at 37°C before quantization.
Determination of Quality and Quantity of Isolated DNA
The isolated DNA is to be used for PCR based study. Therefore, its suitability for PCR along with its size heterogeneity is among the most important criterion for purity. As a matter of general practice all DNA preparations were tested for quality and quantity measures, as described in the following paragraphs. The isolated genomic DNAs were then tested for purity by measuring their absorbance values at 230 nm, 260 nm, 280 nm and 300 nm using a UV visible spectrophotometer (Systronic, India). A DNA preparation was considered to be good if it had A 260 nm / A 280 nm ratio as approximately 1.8 and A 300 nm was 0.1 or lesser. The absorbance at 260 nm was used to calculate the amount of DNA, using the relationship that double stranded DNA at 50μg/ml concentration has an absorbance= 1.0 at 260 nm.
Agarose Gel Electrophoresis
Gel electrophoresis of the genomic DNAs was carried out for qualitative estimation of samples prepared. A good DNA preparation appears as single band. A horizontal agarose slab gel electrophoresis apparatus (Bangalore Genei, Bangaore, India) was used. In brief, 4-5 μl of each genomic DNA was loaded on 0.8 agarose (0.8 % w/v, Sigma) containing ethidium bromide solution (0.5 μg/ml) and electrophoresis was done at 80 V in 1x TAE buffer (40 mM Tris, 20 mM acetic acid, 1 mM EDTA). Lambda DNA EcoRІ / Hind Ш double digest (Bangalore Genei, Bangalore, India) was used as molecular weight marker after completion of electrophoresis, the DNA bands were visualized and photographed using an UV transilluminator (312 nm) and gel documentation system (Vilber Lourmate, Cedex 1, France) respectively.
Polymorphism screening
In general, the genomic DNA extracted from peripheral blood of healthy individuals and diseased individuals was subjected to PCR followed by restriction digestion and electrophoresis to genotype both the groups for relevant gene of interest. All the PCRs were carried out in a PTC 200 thermal cycler (MJ Research Inc. USA). PCR is a rapid, inexpensive and simple mean of producing relatively large copy number of DNA molecules from the small amounts of source DNA material, even when the source DNA is of relatively poor quality. Due to the extreme sensitivity, precautions were taken against contamination of the reaction mixture with the trace amounts of DNA, which could serve as an unwanted template. Appropriate negative control was included in each PCR run carried out for each gene, to monitor this contamination of PCR mix to avoid any false positive results. The negative control used for PCR contained whole PCR reaction mix except target DNA which was replaced by HPLC purified water free of RNase, DNase, and any contamination from any other source resembling the gene sequence.
Subsequently restriction enzyme digestion was performed by incubating the double stranded DNA with appropriate amount of restriction enzyme, in its respective buffer as recommended by the supplier and at optimal temperature for that specific enzyme. A typical digestion includes one unit of enzyme per microgram of starting DNA. One enzyme unit is usually defined as the amount of enzyme needed to completely digest one microgram of double stranded DNA in one hour at the appropriate temperature. Their biochemical activity of the restriction enzyme is the hydrolysis of phosphodiester backbone at specific sites in a DNA sequence. Precaution was taken to avoid star activity of restriction enzymes. When DNA is digested with certain restriction enzymes under non-standard conditions, cleavage can occur at sites different from the normal recognition sequence. Such aberrant cutting is called “star activity” which can be due to high pH (>8.0) or low ionic strength, extremely high concentration of enzyme (>100 U/μg of DNA) and presence of organic solvents in the reaction (e.g., ethanol, DMSO). The PCR and restriction digestion conditions were optimized for specific locus of relevant segment of the gene to be studied. The PCR products as well as the digested products were separated on either agarose gel or polyacrylamide gel depending on their size. Gels were stained with ethidium bromide solution (0.5 μg/ml) and subsequently visualized and photographed under UV transilluminator.
Detection of PPARG2 Single Nucleotide Polymorphism via PCR-RFLP:
The P12A (substitution of A base to C at 12 Exon) polymorphism of PPARG2 gene has been amplified by PCR. This polymorphism is a functional polymorphism causing change of Amino acid from proline to alanine. Primer sequences the oligonucleotide sequence (primers) was designed to amplify the gene wild type gene is lack of restriction site for BstU1 enzyme but Alanine allele contains a restriction site and cleaved in to 227 and 43bp fragment.
Restriction site for BSTU1
CG^CG
GC^GC
Primer sequence
Forward primer (5'-GCCAATTCAAGCCCAGTC-3')
Reverse Primer 5'GATATGTTTGCAGACAGTGTATCAGTGAAGGAATCGCTTTCCG3'
PCR Mix
The PCR was carried out in a final volume of 25 μl, containing 50-100 ng of genomic DNA (4-5 μl), 2.5 μl of 10X Taq polymerase buffer (10 mM Tris HCl pH 8.8, 50 mM KCl, 1.5 mM MgCl2, 0.01% gelatin, 0.005% Tween-20, 0.005% NP-40; final concentration 1X; Genetix Biotech Asia Pvt. Ltd.,India), 1 μl of 10 mM dNTPs (Banglore Genei, Bangalore, India), 1 μl of 25 pmol/μl of forward and reverse primers specific for and 1 μl of unit of 1U/ μl Red Taq DNA polymerase (Bangalore genei).
PCR Thermal Program
After an initial denaturation of 5 min at 95°C, the samples were subjected to 35 cycles at 95°C for 1 min, at 58°C for 45 s, and 72°C for 45 s, with a final extension of 10 min at 72°C in a thermal cycler. A 100bp ladder with amplified product has been run under 2.5 % agarose gel electrophoresis. 238bp product will be generated after PCR.
Restriction Digestion
The amplified product size of 270 base pairs (bp) was digested by the specific restriction enzyme, BstU1. for 16 h at 37°C. The wild-type genotype was not digested, whereas the mutated homozygous genotype was cut as a doublet of 227 and 43 bp. The heterozygous genotype (KQ) was represented as 3 fragments of 270, 227, and 43 bp. Samples were analyzed by electrophoresis using 2.5% agarose gels to analyze the genotype pattern of the gene. When alanine was present at residue 12 of PPARγ2, the 270 bp DNA fragment was split into 227 and 43-bp fragments (heterozygous allele). The digestion products were then separated by electrophoresis on a 2.5% agarose gel. The results were documented by digital camera and further saved by gel documentation system.
Statistical Analysis
To check the difference in the anthropometric and biochemical parameters of obese patients and the non-Obese controls we used student’s t test. Statistical analysis was done by comparing the distribution of genotype frequencies, allele frequencies and carriage rates of all the four polymorphisms in diseased and control group. Disease group included Diabetic patients whereas control group included all healthy controls (HC) enrolled in the study. The proportions of different genotypes for a gene in a population are known as genotype frequencies. The proportion of genotype in a sample will be the ratio of the number of individuals having that genotype to the total number of individuals in the sample. The proportions of different alleles for a gene present in a population are known as allele frequencies. The proportion of an allele in a sample will be the ratio of number of occurrences of the investigated allele in the population to the total number of alleles.
RESULTS
Anthropometric results
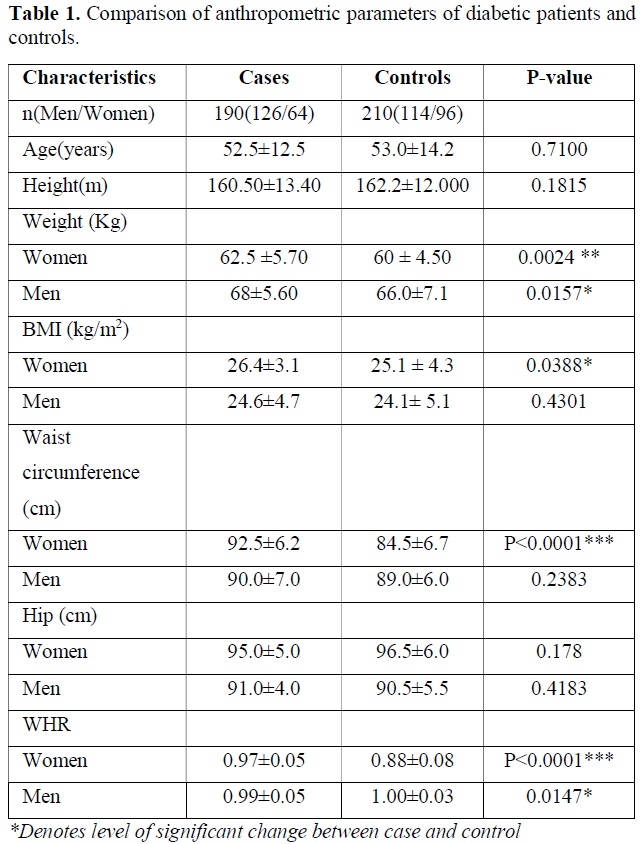
The descriptive data and comparison of anthropometric and biochemical parameters of diabetic patients versus controls are presented in Table 1. The age, sex, BMI, WHR were the parameters. As expected, the diabetic patients had markedly higher levels of weight of women (P=0.0024), Men (P=0.0157) and BMI of Women (P=0.0388), Waist circumference in women (P<0.0001), WHR in Women (P<0.0001) and WHR in Men (P=0.0147). Other results were not found significantly different between case and control group (Table 1).
Biochemical and Clinical Findings
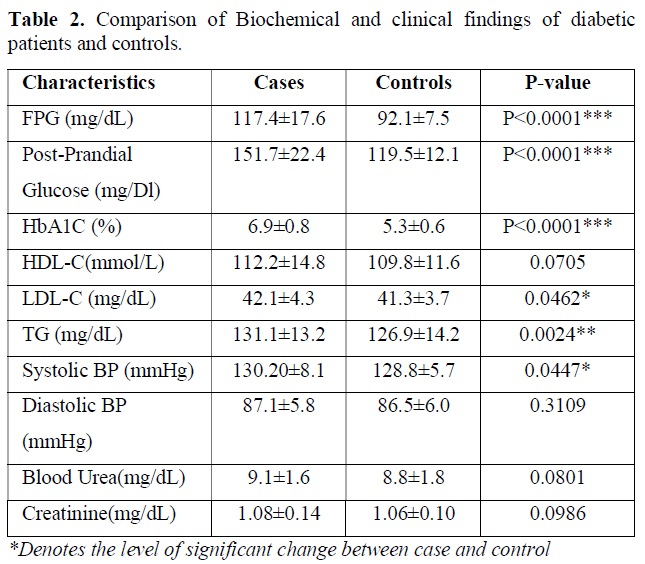
Biochemical test performed in the blood sample for following clinical parameters and the findings were tabulated. Statistical analysis was done by using students t test and p value obtained suggest the level of significant changes here. The descriptive data and comparison of biochemical parameters of diabetic patients versus controls are presented in Table 2. As expected, the diabetic patients had markedly higher levels of fasting plasma glucose (P<0.0001) and HbA1c (P<0.0001) and post prandial glucose (P<0.0001) compared to that of control subject. Nominal difference was also observed for LDL-C (P=0.0462), triglyceride (P=0.0024), systolic blood pressure (P=0.0447). creatine value, blood urea level, HDL-C level and diastolic pressure was not significantly different between two groups and all the clinical test results are tabulated in Table 2.
Detection of Genetic Polymorphism in PPARG2
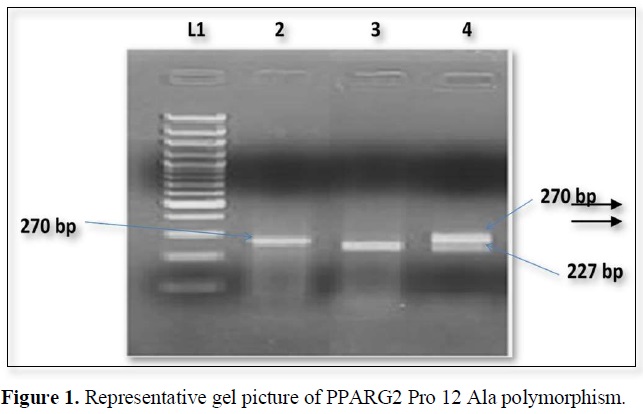
The nucleotide position Pro 12 Ala polymorphism in PPARG2 gene create restriction site for BstU1. The PCR products when digested by restriction enzyme and wild type allele 270bp segment which were generated by PCR but the mutant allele shows 227 and 43 bp segments (Figure 1).

The expected product sizes are: normal homozygote, 270 bp; Pro12Ala homozygote, 227 and 43 bp; and Pro12Ala heterozygote, 270, 227, and 43 bp, respectively. Lane 1, marker, lane 2 Pro homozygote; lane 3, Ala homozygote; lane 4, heterozygote. The 43-bp fragments are not visualized.
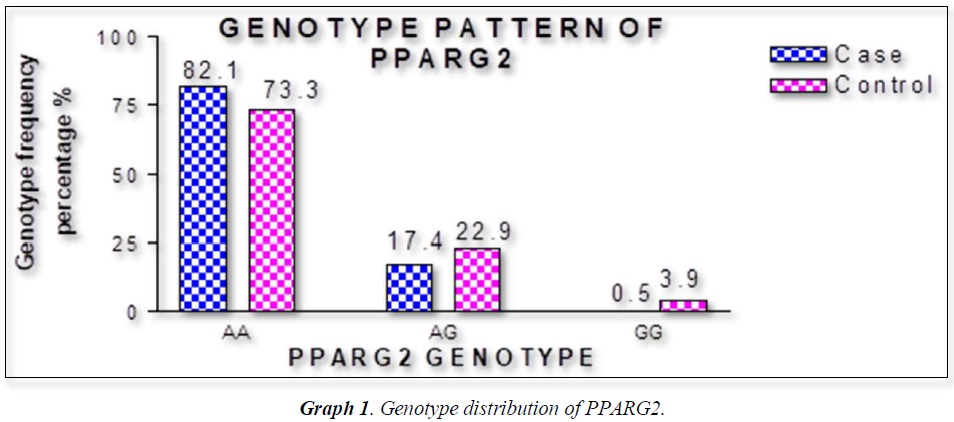
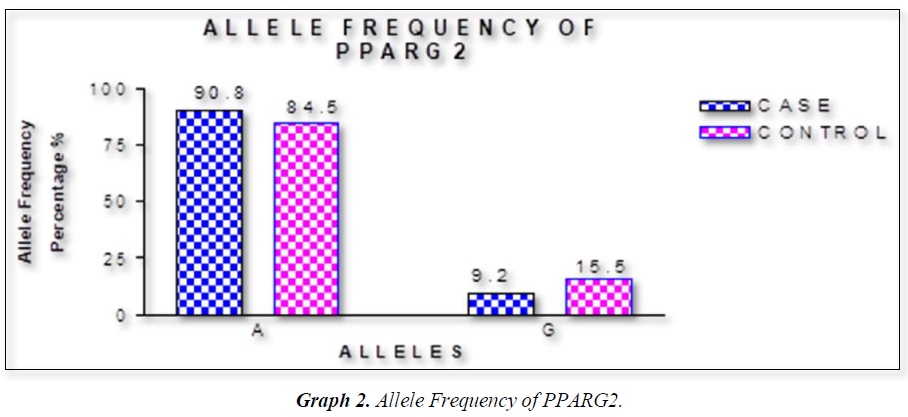
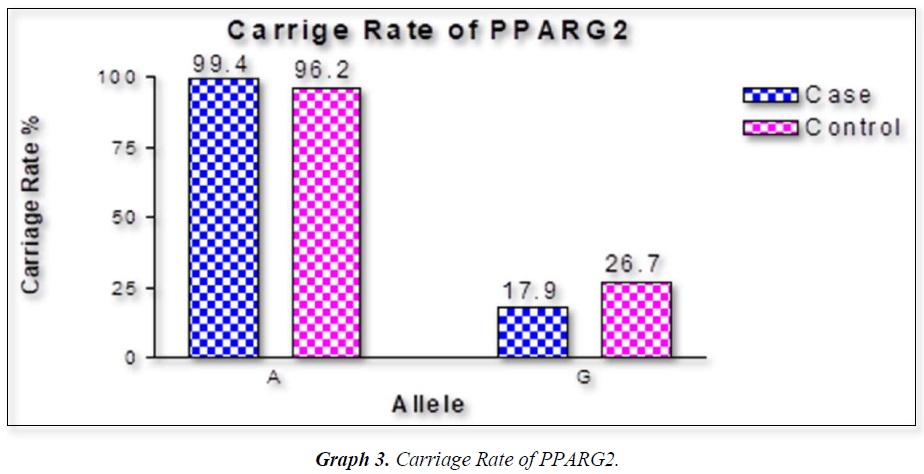
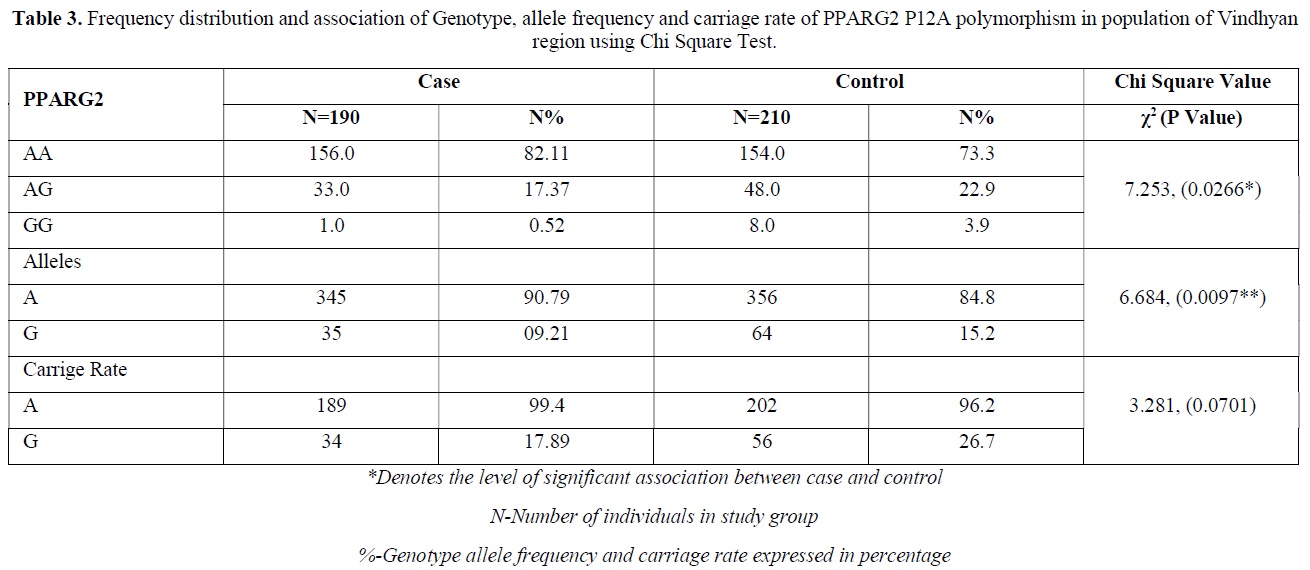
The distribution of polymorphic genotype was strongly under HWE. The observed genotype frequencies, allele frequencies and carriage rates for PPARG2 Pro12Ala polymorphism are depicted in Tables 3 & 4 and Graphs 1-3. Overall distribution of PPARG2 Pro12Ala genotypes was significantly different in HC group as compared to disease group (χ2=7.253, P=0.0266*). HC group showed an increase of mutant ‘GG’ genotype as compared to patients of diabetes type 2 (3.9% vs. 0.52%). Similarly, wild type ‘AA’ genotype was present in significantly low frequency in HC as compared to Diabetes type 2 patients’ group (73.3% vs. 82.11%). An odds ratio of 0.1336 in Diabetes group respectively for ‘GG’ genotype indicated a protective effect of this mutant type genotype in our population whereas an odds ratio of 1.668 of Diabetic patients’ group respectively indicated a positive association of this wild type genotype with the disease, heterozygous is not significantly different but may be protective because of odds ratio of 0.7094. Overall allele ‘G’ was found to be in significantly low frequency in disease group as compared to HC group whereas allele ‘A’ was present in significantly high frequency in the disease group (χ2 = 6.684, P= 0.0097**;). Overall G allele shows an odds ratio of 0.56 which indicates its protective association. Carriage rate of allele ‘G’ was high in HC group whereas carriage rate of allele ‘A’ was high in disease group (χ2 =3.281, P= 0.0701) but the values were not significant. The pattern of genotype and allele distribution in disease and control group suggested a significant association of PPARG2 Pro12Ala wild type allele ‘A’ carriage (carriage of ‘AA’) in Susceptibility to diabetes type 2 and also shows the protective effect of less common mutant allele G.


DISCUSSION
Weight gain has always been known to man to be a sign of good health and prosperity. Surplus energy stored as adipose tissue in the body depots has proved to be an efficient and practical way of making energy available for utilization by the body whenever it is needed [16,19]. Today, however, profound changes have occurred in our lives in association with improved living standards that have led to a markedly reduced need for utilization of stored energy and even for moderate levels of activity [23-26]. Consequently, the prevalence of weight gain and obesity are also rising and becoming a major public health problem in many countries of the world [27]. Table summarizes data on the prevalence of obesity in some developed and developing countries. The countries that have also been affected by these changes are the countries of the Middle Eastern Region. Within the last thirty years, most countries of the Middle East have experienced marked demographic, socio-economic, and life style changes. Traditional dietary habits have been modified due to the combined effect of westernized diets and population mixture, as well as the changes in lifestyle that encourage sedentary habits [28-32]. These changes have led to a profound alteration in the health and nutritional status of the concerned populations. Morbidity and mortality rates from infectious diseases and under-nutrition have decreased, to be replaced by rapidly rising rates of chronic non-communicable diseases such as NIDDM, CHD, and cancer. Furthermore, the sedentary life that has resulted from this improved socio-economic status, has led to an increase in the prevalence of overweight and obesity among populations in the Middle East [33-36]. In our results we found that rare ala allele ‘G’ was found to be in significantly low frequency in disease group as compared to Control group, whereas wild type allele ‘A’ was present in significantly high frequency in the disease group. These finding suggests that G allele may have a protective effect against pathophysiology of diabetes type 2. This study was done in small sample size but despite the sample size we found a strong relation with protection against diabetes type 2. Our study started from biochemical parameters related to obesity. We found BMI in female (0.0388*) and WHR (P<0.0001***) having strong correlation to obesity. Biochemical parameter FPG (mg/dL) (P<0.0001***), Post-Prandial Glucose (mg/Dl) (P<0.0001***) were significantly associated to obesity. Gene PPARG2 having G and A alleles. The genotypic distribution of AA, AG is more than AA where p value is 7.253, (0.0266*). The allelic frequency of A is high in comparison to G alleles where p value is 6.684, (0.0097**) thus the carriage rate of A allele is high in comparison to G allele. In our study the ala allele is found significantly protective and was in healthy control in higher percentage as compared to Case (15.2 Vs 9.21%).
The PPARG2 gene abundantly expressed in adipose tissue has several variants, one of the most common (minor allele frequency of 10% in Caucasians) is the Pro12Ala substitution at codon 12 in PPARG2. This polymorphism has been shown to be associated with reduced ability to Trans-activate responsive promoters and thus with lower PPARG2 transcriptional activity [31-35]. The importance of PPARG2 in lipid, glucose and energy metabolism is well established. Since PPARG2 promotes adipocyte differentiation, it is an attractive candidate gene for states of altered triglyceride storage, such as obesity or conditions associated with underweight. Since the Pro12 allele is present in at least 80% of humans, the population attributable to risk of type 2 diabetes associated with this polymorphism is as high as 25% [6,13]. More consistently, the Pro12Ala polymorphism has been associated with a lower risk of type 2 diabetes in a meta-analysis of genome-wide association studies [33]. This gene is a confirmed type 2 diabetes susceptibility locus and is one of most 20 type 2 diabetes susceptibility loci identified over the last few years [32,36].
In our study population, odds ratio of mutant AA genotype was 0.13 and heterozygous AG was 0.70 these results suggest that PPARG2 Pro 12 Ala polymorphism could be protective against Obesity. The overall Odds ratio of less common ‘A’ allele was 0.56 which clearly indicates the possible protective role of PPARG2 Ala Allele.


REFERENCES
No Files Found


Internationally Accepted
Share Your Publication :