
-
Publish Your Research/Review Articles in our High Quality Journal for just USD $99*+Taxes( *T&C Apply)
Offer Ends On
Publish Your Research/Review Articles in our High Quality Journal for just USD $99*+Taxes( *T&C Apply)
Offer Ends On
Nabil M Jabbour*, Antonio Yaghy and Micah M Jabbour
Corresponding Author: Nabil M Jabbour, West Virginia University Eye Institute, USA.
Received: July 01, 2024 ; Revised: July 16, 2024 ; Accepted: July 19, 2024 ; Available Online: August 14, 2024
Citation: Jabbour NM, Yaghy A & Jabbour MM. (2024) The Missing Link: Bridging the Gap between Clinical Research and Clinical Practice. J Clin Ophthalmol Optom Res, 2(1): 1-8.
Copyrights: ©2024 Jabbour NM, Yaghy A & Jabbour MM. This is an open-access article distributed under the terms of the Creative Commons Attribution License, which permits unrestricted use, distribution, and reproduction in any medium, provided the original author and source are credited.
Views & Citations
Likes & Shares
This study addresses the critical gap between protocol-guided clinical trials and real-world clinical practice in medical treatment. We propose a novel approach called Custom-Designed Approach to Treatment with Algorithms (C-DATA) to bridge this gap. The manuscript outlines the development, implementation, and evaluation of C-DATA, using examples from ophthalmology while highlighting its applicability across medical specialties. The C-DATA methodology involves a comprehensive literature review, extraction of basic principles, alignment of general information with case-specific features, and the creation of a custom-designed algorithm. This approach is implemented through a structured process including the development of a preference list for treatment options, creation of an algorithmic matrix, and continuous evaluation and modification based on real-world outcomes. Results from initial studies using C-DATA in treating Macular Edema and Choroidal Neovascularization demonstrate significant improvements in long-term anatomic and visual outcomes, patient compliance, and reduced treatment burden compared to protocol-guided approaches. The C-DATA method also shows potential for cost-effectiveness and optimized resource allocation in healthcare systems. We recommend implementing C-DATA-based "bridge" clinical studies following FDA approval and before widespread clinical use to optimize treatment recommendations. This approach offers a flexible framework for translating clinical trial results into tailored, real-world treatment strategies, potentially improving patient care across various medical specialties.
Keywords: Custom-Designed Approach to Treatment with Algorithms (C-DATA), Bridge studies, Real-world clinical practice, Treatment optimization, Personalized medicine
INTRODUCTION
Clinical prospective medical research relies heavily on well-designed, objective, and reproducible protocols used in clinical trials (CTs) to evaluate the safety and efficacy of proposed treatment methods. While essential for validating new concepts and transitioning them from the ‘lab’ to the ‘market’, the focus on regimented protocols often overshadows the inherent complexity and variability of real-world scenarios and thus becomes insufficient when used as the sole reference and guideline for real-life applications. In a previous publication, we demonstrated a critical gap between CT treatment recommendations, based on trial protocols, and the requirements of real-world clinical practice. This discrepancy is seldom addressed by post-market clinical studies, as they typically adhere to the original CT protocol or a variant thereof. To bridge this gap, we proposed the need for a "Custom-Designed Approach to Treatment with Algorithms" (C-DATA) [1]. Once clinicians acknowledge the necessity of an algorithm-guided approach rather than a protocol-guided one to address this gap, the next challenge becomes constructing such an algorithm. This article outlines the development of this approach and the construction of algorithms based on principles derived from controlled trial protocols, but tailored for application in the unique, diverse, and often chaotic settings of individual cases in real-life clinical practice. Our objective is to encourage and facilitate clinical research across various medical fields to bridge the gap between CT protocol-dictated treatments and real-life needs. We will detail the steps required to construct, test, modify, and promote a custom-designed, algorithmic treatment approach (C-DATA). This includes guidelines for obtaining vital disease-specific and treatment-specific information through critical literature review and analysis, without being overwhelmed by unanswered questions. We will also provide illustrated instructions on acquiring, applying, and analyzing case-specific outcomes and response data to develop the required approach. Finally, we will demonstrate how to build, evaluate, prospectively modify/maintain, and share the desired algorithms. Given the multitude of medical specialties where this approach is applicable, we will limit our sample illustrations to the field of Ophthalmology. However, the similarities with other medical specialties, particularly Oncology, will be evident. Consequently, the conclusions and recommendations can be applied universally with minimal adaptive effort.
MATERIALS AND METHODS
Constructing a Custom-Designed Algorithm (CDA) may appear challenging, but the key lies in breaking it down into separate components and then working out the interactions and iterations to arrive at a user-friendly, efficient, and scientifically sound approach. Using our Ophthalmology model, we will demonstrate how to develop this approach step by step:
In this section, we will examine illustrative examples from recent ophthalmology literature to extract vital disease-specific and treatment-specific data. We will highlight the lack of universally proven recommendations for clinical applications, despite numerous clinical trials (CTs) and post-FDA approval studies. Our focus will be on pharmacologic treatments for macular edema (ME) and sub-macular neovascularization (SMN).
Original and subsequent CT protocols for "solo treatment" were designed with specific parameters, including intravitreal injection as one specific dose, typically administered every 4 weeks, for a minimum duration of one to two years. Response assessment was based on two primary outcome variables: change in best-corrected visual acuity (BCVA) and anatomic changes on Optical Coherence Tomography (OCT) scans, such as lesions, edema, fluid, and new vessels. Although modifications were made to doses and intervals over time, the protocol-dominated design persisted [2-4]. This approach carried through to everyday clinical practice, as reflected in drug inserts [5,6]. While the general principles learned from CTs and subsequent studies have proven helpful, several critical questions remain unanswered:
The aforementioned uncertainties have led to significant confusion in comparing and choosing treatment options, both solo and in combination. Instead of clear recommendations on when to declare "non-response" to a certain agent and explore alternatives, this confusion has permeated post-market, protocol-based studies, further complicating the issue. The consequences of this confusion are not limited to poorer clinical outcomes but have also contributed to increased treatment burden and patient non-compliance, magnifying the overall negative impact [10-13].
While the general principles provided by a verified Clinical Trial (CT) protocol form the backbone of a usable and accurate Custom-Designed Algorithm (CDA), this information, though necessary, is not sufficient. A comprehensive understanding of the following aspects is crucial for developing an effective CDA:
As previously demonstrated, group response analysis can be misleading when applied to individual outcomes. For instance, while a 65% rate of patients with "improved or stable vision" may be considered a respectable group outcome, this approach neglects the 35% who do not benefit. Moreover, even within the 65% who are "doing well," there may be opportunities for improvement with a reduced treatment burden [1].
Data collection and analysis should be conducted prospectively using a registry-based approach, ensuring easy access to both individual and cohort response changes.
Building upon the guidelines established earlier and the prospectively obtained "individual-based" outcome and profile variables, we will now demonstrate the process of developing this concept into a practical tool for real-life clinical application. This approach consists of two distinct phases: the study phase and the practice phase. The primary objective of this paper is to inform, encourage, and facilitate the study phase. We will illustrate how to sequentially construct, use, and modify each algorithm, as well as how to make it accessible and useful in everyday clinical practice. This process requires: a comprehensive understanding of the general information from literature and package inserts as well as a method for creating and/or using a C-DATA matrix. While the first task aligns with standard practices associated with using medical drugs or devices, the latter involves the novel approach we are advocating in this article. Steps Involved in Creating, Using, and Modifying a C-DATA Matrix To effectively implement the C-DATA approach, clinicians need to follow a structured process.
Step One: The Preference List (PL)
Each treating physician (or study designer) selects a “preference list” ranking treatment options from first to last choice. This list can be physician-specific, especially when literature is ambiguous about a first choice, or case-specific. For example, Anti-VEGFs available for treating Macular Edema (ME) and Choroidal Neovascularization (CNV) have different molecular sizes. Smaller compounds may be more suitable for deeper lesions due to better penetration, while larger ones may be more appropriate for superficial lesions and may have a longer duration of action in the vitreous [14,15].
Step Two: The Algorithmic Matrix
This algorithm recommends treatment based on eye-specific outcomes, considering consequential outcome variables and each case's treatment profile. The process differs slightly for initial treatment versus follow-up or eyes with a treatment history.
For treatment-naive eyes, baseline data for outcome variables is collected. In our ophthalmology example, this includes OCT and BCVA. Subsequently, an intravitreal injection of the top-ranked agent from the preference list is administered at the FDA-approved dose. Four weeks later, OCT and BCVA measurements are repeated and compared to the baseline. The response is then graded on a predetermined scale. This grading occurs after each round of treatment. OCT image comparison, used to determine the anatomic response to treatment, can be performed either digitally (with or without AI assistance) or semi quantitatively. The latter requires minimal training and no advanced devices. For the purposes of this discussion, we will use semiquantitative grading, which can be easily transposed to more accurate quantitative/digital values when available.
Treatment recommendations are based on these responses as shown in Figure 1 (top).
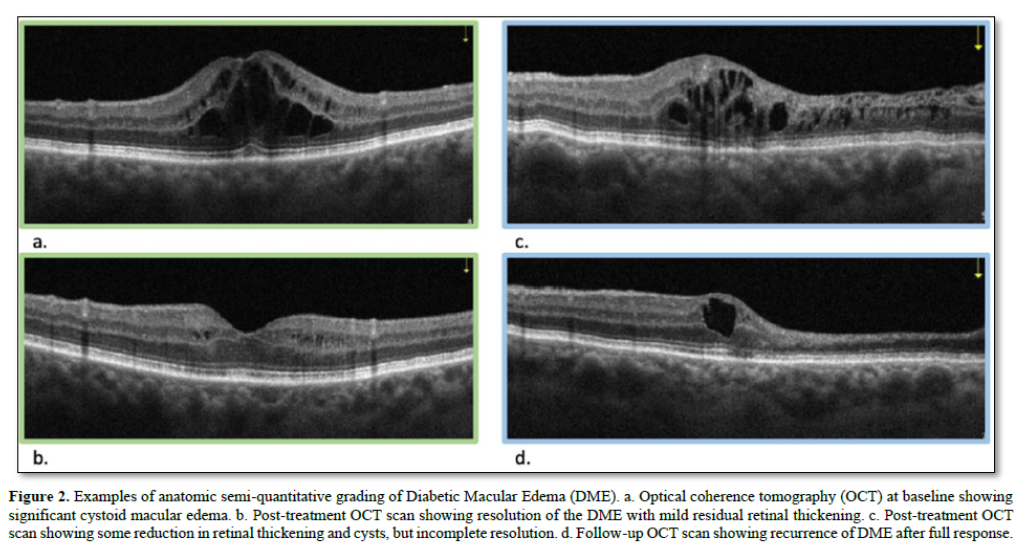
The algorithm guides clinicians through decision-making processes for subsequent treatments based on the patient's response to previous interventions, allowing for personalized and adaptive care in managing retinal conditions (Figure 2).
For follow-up after initial or multiple non-algorithm-guided treatments:
The final score (Σ) for each follow-up comprises a letter (F, P, or N) describing regression status compared to baseline, and a number showing the sum of improvement, stability, or worsening in both OCT and BCVA scores. For example, if there's 85% regression after the first treatment and 90% regression on the second visit, the OCT score would be "F +2". If vision improved, the BCVA score would be "+1", resulting in an overall score of "F+3". Conversely, if vision worsened, the overall score would be "F+1". Treatment recommendations based on these overall response-based scores are detailed in.
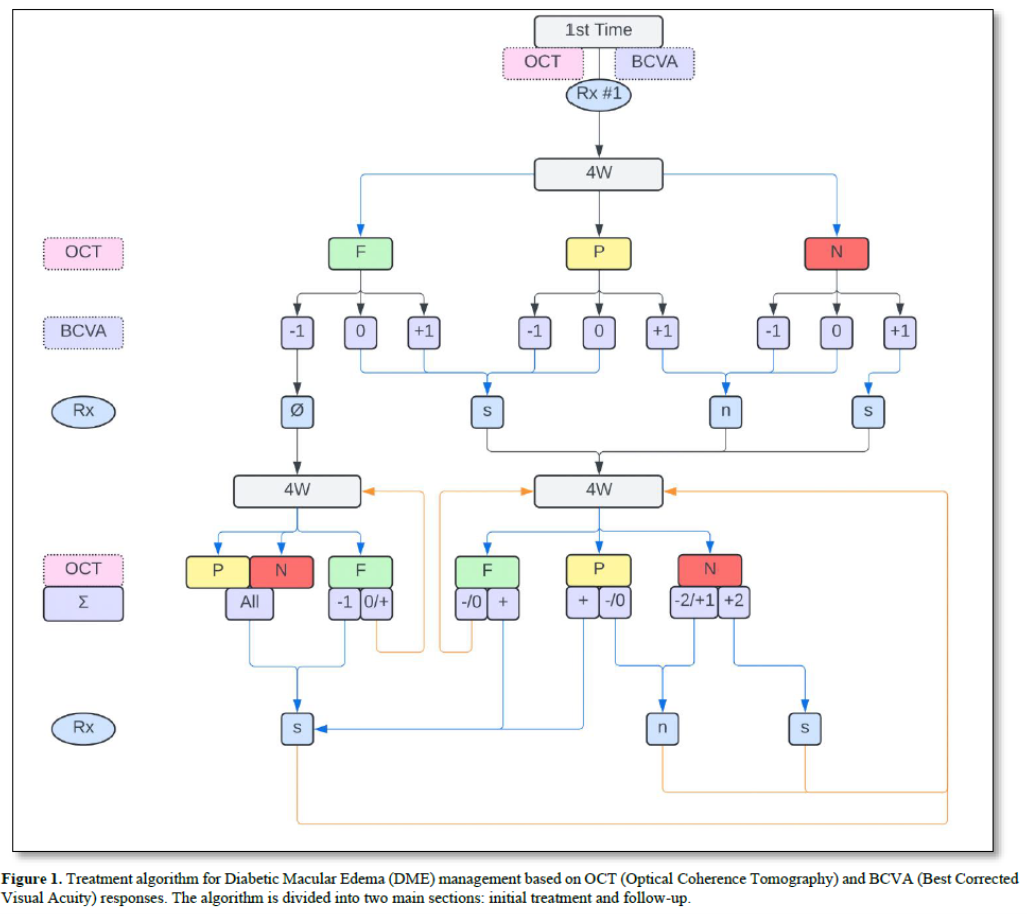

In all cases, if there is a decrease in BCVA exceeding 25%, further investigation is necessary, and the algorithm may be modified or suspended.
Step Three: Using, Evaluating, and Modifying/Updating the Algorithm
The study phase of the C-DATA approach has distinct characteristics that set it apart from traditional clinical trials. It does not require a "control" arm or masking, as data comparison is case-specific, with each eye serving as its own control. This design allows for ongoing prospective analysis, which facilitates continuous algorithm evaluation and modification. To ensure the effectiveness of the algorithmic approach, overall clinical results are compared to protocol-based studies for non-inferiority, and the comparative data is used to optimize the final product. This dynamic and adaptive design enables researchers to efficiently refine the algorithm based on real-world outcomes, potentially leading to more effective and personalized treatment strategies.
Step Four: The Practice Phase
Upon completion of the study phase, the optimized algorithmic approach is prepared for widespread clinical use. This preparation includes making the final product accessible to all clinicians in a user-friendly format and providing comprehensive training on the proper use of the algorithm, monitoring procedures, and reporting of positive and negative events. The approach can be implemented with or without IT and/or portable apps, offering flexibility in various clinical settings. Additionally, our team provides ongoing support, offering consultation and advice on all development phases, with a particular focus on study design and the basic logic for each matrix. This comprehensive rollout strategy ensures that clinicians are well-equipped to implement the C-DATA approach safely and effectively in their practice.
RESULTS
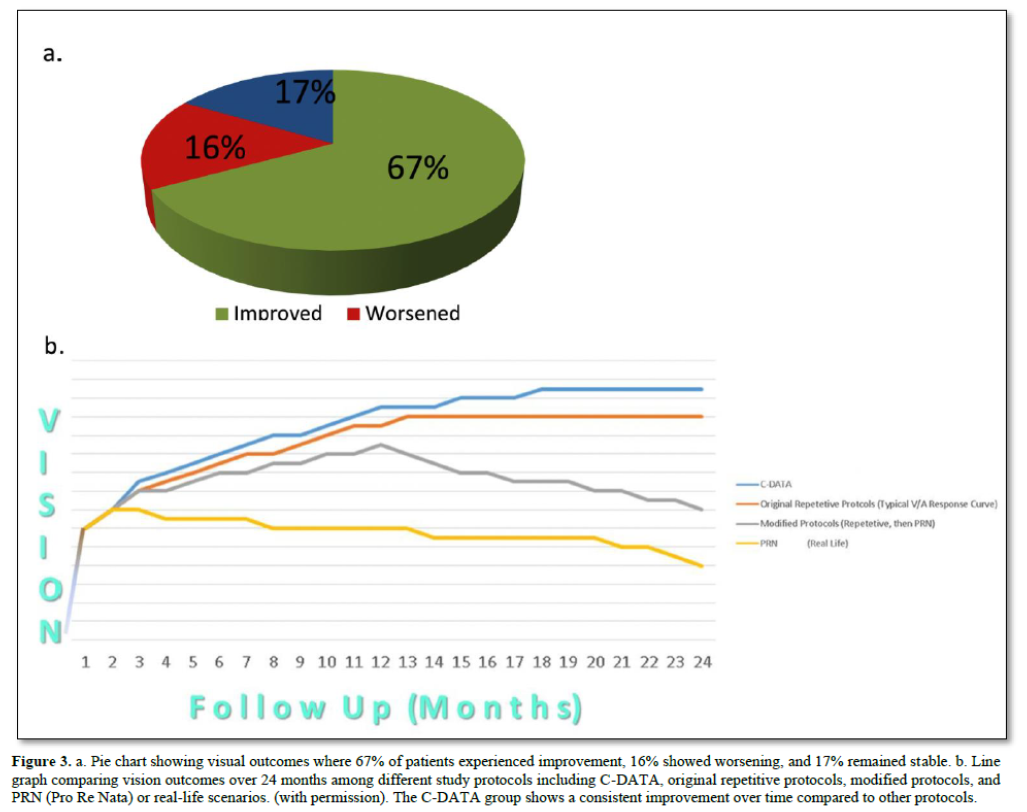
Applying the principles and approach detailed above, we created an algorithm, constructed a matrix, and designed prospective studies to utilize Custom-Designed Approach to Treatment with Algorithms (C-DATA) in the treatment of Macular Edema (ME) and Choroidal Neovascularization (CNV). While the comprehensive design and results of these studies have been presented and published elsewhere [16], a brief overview of the results demonstrates consistent advantages when compared with protocol-guided studies, both pre- and post-market. C-DATA resulted in improved outcomes across several key metrics (Figure 3) [16].
DISCUSSION
The practice of requiring recurrent/periodic treatments to simulate a study protocol has led many practitioners to blur the lines between "response," "resistance," "recurrence," and "non-response." Furthermore, unanswered questions about loading doses (the "n") and "as-needed" (PRN) regimens have left clinicians uncertain about best practices [17]. This pitfall, long present in oncology, has become increasingly problematic in ophthalmology and several other specialties, particularly concerning pharmacological treatments. For instance, clinical trial protocols for pharmacologic treatment of ME and CNV mandated monthly eye injections for at least one year, regardless of the response. While necessary for controlled phase III studies, this approach led to suboptimal outcomes for at least two-thirds of patients in real-life settings, delaying more effective treatment options while multiplying side effects. Moreover, this practice skewed objective post-market feedback, which is vital for research and development as well as regulatory oversight.
 Similar unintended negative outcomes have plagued many cancer treatments due to the application of chemotherapeutic protocols in clinical practice based directly on clinical trial protocols, without the benefit of a "bridge" study to optimize the treatment approach for best results. The Custom-Designed Approach to Treatment with Algorithms (C-DATA) that we advocate serves as the necessary bridge, supplying the missing link between protocol-guided treatment approaches and real-life clinical scenarios. In addition, the C-DATA approach can help achieve cost-effectiveness through several mechanisms. By tailoring treatment to individual patient responses, it optimizes drug usage, reducing unnecessary administration and leading to cost savings without compromising efficacy. Improved clinical outcomes result in fewer complications and less need for additional interventions, further reducing healthcare costs. The cost savings achieved through optimized treatment allow for increased access, enabling more patients to receive appropriate care within existing budget constraints. Additionally, fewer unnecessary treatments reduce the burden on both patients and healthcare providers in terms of time and resources. Finally, by preventing disease progression and reducing complications, C-DATA can lead to substantial long-term cost savings for healthcare systems and the workforce.
FUTURE DIRECTION
We strongly recommend implementing these "bridge" clinical studies, based on the principles detailed in this article, following FDA approval and prior to the customary widespread use that is typically based solely on protocol-guided clinical trials. This approach has the potential to significantly improve patient outcomes, reduce treatment burden, and optimize resource allocation in healthcare systems across various medical specialties.
SUMMARY
This study underscores the critical need for “bridge” clinical studies that are not based on rigid protocols to optimize new treatment recommendations. These studies should be conducted following protocol-guided Clinical Trials (CTs) and before general clinical use. We have demonstrated that even well-researched recommendations often fall short of providing guidance for best clinical practices. To address this gap, we propose that such studies should be based on the (C-DATA) methodology. Key steps in implementing the C-DATA approach include:
By following this approach, we can bridge the gap between protocol-guided clinical trials and real-world clinical practice, leading to:
The C-DATA methodology offers a structured yet flexible framework for translating clinical trial results into optimized, real-world treatment strategies. This approach has the potential to significantly improve patient care across various medical specialties by providing clinicians with tools to make more informed, patient-specific treatment decisions. As medical knowledge and treatment options continue to evolve rapidly, the implementation of C-DATA can help ensure that clinical practice remains at the forefront of evidence-based medicine while accounting for individual patient needs and responses.


No Files Found


Internationally Accepted
Share Your Publication :