
-
Publish Your Research/Review Articles in our High Quality Journal for just USD $99*+Taxes( *T&C Apply)
Offer Ends On
Publish Your Research/Review Articles in our High Quality Journal for just USD $99*+Taxes( *T&C Apply)
Offer Ends On
Yusuke Kuroda*, Shota Nakazawa and Satoshi Iwamura
Corresponding Author: Yusuke Kuroda, Ph. D., Researcher, Exercise and Sport Science, Institute of Health and Sport Sciences, University of Tsukuba, Japan.
Received: December 02, 2024 ; Revised: December 12, 2024 ; Accepted: December 15, 2024 ; Available Online: December 18, 2024
Citation:
Copyrights:
Views & Citations
Likes & Shares
Expanding the number of spectators is one of crucial issues for both the popularization of sports and the improvement of competitive performance within sports organizations. This study aims to provide valuable insights for sports organizations seeking to expand their spectator base by examining the key determinants of sports spectating. We investigated the factors influencing sports spectating through decision tree analysis by utilizing secondary data from a national survey conducted by the Sasakawa Sports Foundation (SSF) in 2022. Similar to the previous international studies, the findings confirm that factors identified-such as gender, age, economic status, education level, place of residence, and current sports participation-are strongly related to sports spectating in Japan. Furthermore, the decision tree analysis identified that the major factors influencing spectator behavior are current sports participation, gender, age, and household income. Based on the findings, the research suggests that sports organizations should recognize the diverse factors underlying spectating behavior, adopt relationship marketing strategies considering the strong association with current sports participation, and develop ticketing and promotional strategies based on the spectators’ gender, age, and household income.
Keywords: Sports spectating behavior, Sports organizations, Current sports participation, National survey, Decision tree analysis
INTRODUCTION
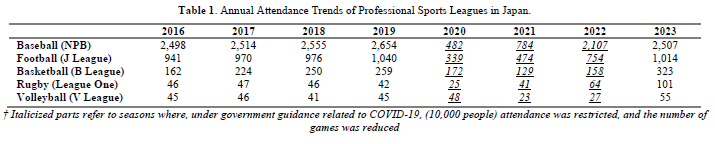
In Japan, the professionalization of various sports has been on-going, and the sports spectators’ population is increasing every year (excluding the period during which COVID-19 preventive measures were implemented (Table 1). For individuals, there are various benefits by sports spectating, such as maintaining and improving mental health [1] enhancing quality of life [2-3] and offering new learning opportunities [4-5]. In addition to these benefits by spectating for individuals, expanding the spectator population can also make contribution to the popularization of the sport and the overall improvement of competition and performance [6,7] thus making it an important issue for many sports organizations [8]. There are numerous factors that can influence behavior of sports spectators, and they are: gender, age, economic status, educational level, residential area, and sports participation level.
Gender and Sports Spectating Behavior
One of the significant factors influencing sports spectating behavior is gender. According to a study by Wann and Branscombe [9], male spectators tend to show a strong interest in competitions and performance of athletes; while, women spectators are more likely to prioritize social interactions and spending time with family during games/matches [9,10] also pointed out that male spectators tend to have a higher level of identification with sports teams and athletes that they support, whereas female spectators tend to enjoy the social components of spectating. These studies suggested that motivational differences of spectating behavior between gender should be considered in marketing strategies and fan engagement activities in sporting events. In Japan, Nakazawa et al. emphasized the significance of ancillary services in enhancing the experience of female spectators in stadiums and arenas. Their study, which analyzed data from Japanese J. League soccer spectators, found that the availability and quality of these services play a critical role in attracting and retaining female attendees [11].
Age and Sports Spectating Behavior
Age is considered as another significant factor that can affect sports spectating behavior. Younger spectators tend to engage in sports via the social media and interaction with other fans using online [12] while older spectators prefer using more traditional media [13]. Robinson and Trail [14] also suggested younger spectators are attracted to the excitement and entertainment aspects of sports, and older spectators are more likely to spectate due to long-standing habits and attachment to their teams [14].
Economic Status and Sports Spectating Behavior
Economic status of individuals can be a factor influencing sports spectating behavior. According to Mullin et al., individuals with higher disposable incomes are more likely to attend live sporting events more frequently than those with lower disposable incomes [15] as Green and Chalip [16] pointed out that economic constraints limit the participation of live events by low-income individuals and leading them to rely on free or low-cost viewing options [16]. Based on these studies, pricing strategies and promotions tailored to different economic segments of spectators become one of important factors in sports marketing.
Educational Level and Sports Spectating Behavior
Educational level can be a significant factor influencing sports spectating behavior [17-19]. Some sports will more likely to attract highly educated individuals than individuals with lower educational background [17]. For example, sports that require technical and strategic understanding (e.g., golf, tennis) are more likely to be preferred by those with higher education, likely due to their tendency to seek intellectual challenges and deeper understanding of actions. A study by Tainsky and McEvoy [18] showed that those with lower educational levels are more likely to prefer more common and widely accessible sports like football and basketball, and highly educated individuals tend to participate and watch more variety of sporting events. This suggests that educational level widens the range of spectating behavior [18,19]. Trail [19] found that primarily reason for individuals with higher educational levels to attend sporting events is to expand their knowledge and pursue cultural values. On the other hand, individuals with lower educational levels often cite entertainment and social interaction as their main motivations for attending sporting events [19]. These motivational differences are contributing to the diversity in spectating behavior.
Residential Area and Sports Spectating Behavior
Residential area can also be a significant factor influencing sports spectating behavior because differences between residing in urban or rural areas and regional cultural variations are affecting spectating behavior. Funk [20] showed that people living in urban areas have more opportunities to watch live sports than those in rural areas, resulting in more active spectating behavior. Urban areas have more sports facilities and teams, with better access to them, making sporting teams/events easier to promote spectating behavior. Additionally, many sports teams are community-oriented, and supporting local teams strengthens the sense of community, more commonly in urban areas.
Wann [9] reported the impact caused by regional sports culture on sports spectating behavior, and results showed that certain sports are particularly popular in specific regions for example, American football is extremely popular in the southern part of the United States, where many residents are avid spectators. We can assume that regional culture is a crucial factor shaping sports spectating behavior based on this result. Furthermore, Robinson and Trail [14] pointed out that the culturally diverse population in urban areas are contributing to the diversity of sports spectating behavior. Multiple sports are supported in urban areas because people tend to become enthusiastic in different sports due to their diverse backgrounds. In contrast, rural areas often exhibit strong unity towards specific sports, with spectating behavior generally focusing only on that sport [14,19].
Sports Participation and Sports Spectating Behavior
Many studies have explored how sports participation impacted on sports spectating behavior. A study by Funk [20] showed that individuals who participate in sports tend to have a higher interest and loyalty to the sports that they watch. These individuals are strongly motivated as spectators, particularly in the sports that they are participating due to the technical understanding and strategic knowledge they have through playing, which is enhancing their spectating behavior pointed out that the spectating behavior of sports participants holds significance beyond mere entertainment because sports participation contributes to reinforcing self-identity and social identity. Specifically, the self-efficacy and community connections gained through playing sports are further strengthened through spectating. Funk [20] reported that sports participants attend sports events more frequently and spend more time watching sports through media than non-participants. Their research indicated that sports participants actively become spectators and show a high overall interest in sports. This suggests that increasing playing population of sports is one of the key factors promoting spectating behavior.
RESEARCH OBJECTIVES AND METHODS
Objectives
This research will attempt to obtain useful information for Japanese sports organizations seeking to expand their spectator base by analyzing the determinants of sports spectating behavior. The data analyzed derived from a sample that was appropriately drawn to represent the entire Japanese population aged 18 and over, allowing for a macro-level analysis representative of Japan as a whole. Therefore, the results of this study are expected to be of significant value as a reference material. Two main objectives of this research are: 1). examining whether there is a relationship between sports spectating behavior in Japan and the beavering factors suggested by previous research, and 2). attempting to create a predictive model that explains spectating behavior in Japan based on decision tree analysis.
Methods
Participants
In this study, we utilized secondary data from the Sasakawa Sports Foundation (SSF) National Sports-Life Survey in 2022, which was conducted according to the following specifications:
Population: Individuals aged 18 and over residing in municipalities across Japan.
Sample Size: 3,000 individuals.
Number of Locations: 300 locations (90 in large cities, 122 in cities with populations over 100,000, 64 in cities with populations under 100,000, and 24 in towns and villages).
Sampling Method: Quota sampling.
Classification by Region: Municipalities across Japan were classified into 11 regions based on prefectures.
Stratification by City Size: The regions were further stratified by city size into large cities, cities with populations over 100,000, cities with populations under 100,000, and towns and villages.
Distribution of Locations and Samples: Based on the population estimates of individuals aged 18 and over in each stratum (region and city size) derived from the Basic Resident Register, 300 locations were proportionally distributed. The sample size per location was set at 10, totaling 3,000 and was allocated in a manner that approximated the age-specific population distribution within each stratum.
Data collection period: The SSF’s national survey was conducted between June 10, 2022 and July 10, 2022.
The decision tree model
The decision tree model is a widely used statistical and machine learning methods that is particularly effective for classification and regression tasks. It is a non-parametric, supervised learning algorithm that makes decisions based on the input features of the data, leading to a prediction or classification outcome. The model is structured as a tree-like graph, where each internal node represents a "decision" based on the value of an input feature, each branch represents the outcome of that decision, and each leaf node represents a final prediction or classification [21-23].
Analytical Procedures
In this study, the first step was to analyze whether the relationship between sports spectating behavior and the factors previously suggested by studies from other countries are related to these key behaviors (gender, age, economic status, educational attainment, residence, and current sports participation) and to determine whether similar relationships are observed in Japan. This analysis involved cross-tabulation and the use of the chi-square test (χ²) to examine the significance of these relationships. Decision tree analysis was conducted, using the factors found to have statistically significant relationships as explanatory variables, to distinguish between samples of those who engaged in sports spectating behavior and those who do not, and to identify factors that influenced spectating behavior. In the decision tree analysis, the depth of the tree was set to automatic, and the maximum level was set to three (3) due to the use of the CHAID method. All analyses were performed using the statistical software IBM SPSS for Windows (version 29.0, IBM Corp.). Statistical significance was set at p < 0.05. This type of analysis reveals the cut-off point values and categories of independent variables that best split the sample into nodes, thereby increasing the importance of each variable in the model. The tree generated is displayed visually, which makes it easier to understand [24,25]. In data mining research, decision trees are helpful for both categorical and numerical data, whether combined or separately [26].
RESULTS AND DISCUSSION
Sample Characteristics
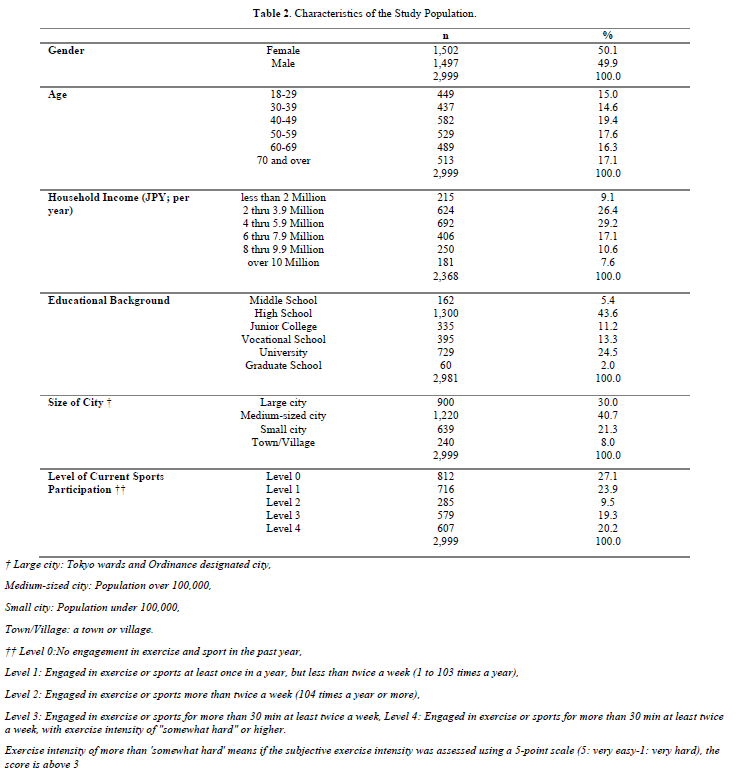
Regarding gender, participants were evenly distributed between males (50.1%) and females (49.9%). In terms of age, the 40s age group had the highest representation (19.4%), while the 18-20s (15.0%) and 30s (14.6%) had lower percentages. Concerning economic status, the most common household income range was 4 to 6 million yen (29.2%), followed by 2 to 4 million yen (26.4%). As for educational level, the highest percentage of respondents reported high school as their highest level of education (43.6%), followed by university degree (24.5%). Regarding residence, the highest percentage of participants lived in medium-sized cities (40.7%), followed by those in large cities (30.0%). With respect to current sports participation, the highest percentage of participants reported Level 0 (27.1%), followed by Level 1 (23.9%) (Table 2).
The data used in this study were created using a stratified quota sampling method based on gender, age, and residence, in accordance with the Japanese Basic Resident Register. In instances where selected participants declined to participate, they were replaced by other individuals with the same gender, age, and residence. Consequently, the demographic characteristics presented below align with those of the Japanese Basic Resident Register.
Relationship Between Factors Suggested to Be Related to Spectating Behavior and Spectating Behavior
As shown in Table 3, all variables used as explanatory factors in the decision tree analysis (age, household income, educational level, size of city, and level of current sports participation) were found to have a significant relationship with spectating behavior (p < .001). Specifically, the analysis revealed that 1) male spectators were more likely than female spectators, 2) younger spectators were more likely than older spectators (though some discontinuous trends were observed), 3) those with higher household incomes were
more likely than those with lower incomes (though some discontinuous trends were observed), 4) those with
higher educational backgrounds were more likely than those with lower educational backgrounds (though some discontinuous trends were observed), 5) individuals living in large cities were more likely, and 6) those who currently participate in sports were more likely to exhibit active spectating behavior. These results align with those identified in previous studies from other countries [12,17, 20]. It was concluded that sports organizations aiming to expand the population of spectators must understand these relationships and develop strategies accordingly.

Determinants of Sports Spectating Behavior Based on the Decision Tree Model
As shown in Figure 1, the results of the decision tree model analysis consisted of nine nodes and three layers. The factor most strongly associated with the presence or absence of spectating behavior was the level of current sports participation. Spectating behavior was most active at Level 4 and least active at Level 0. Within the Level 4 segment, the next significant factor after the level of sports participation was age. Among those at Level four 4 and under the age of 50, 33.8% engaged in spectating behavior.
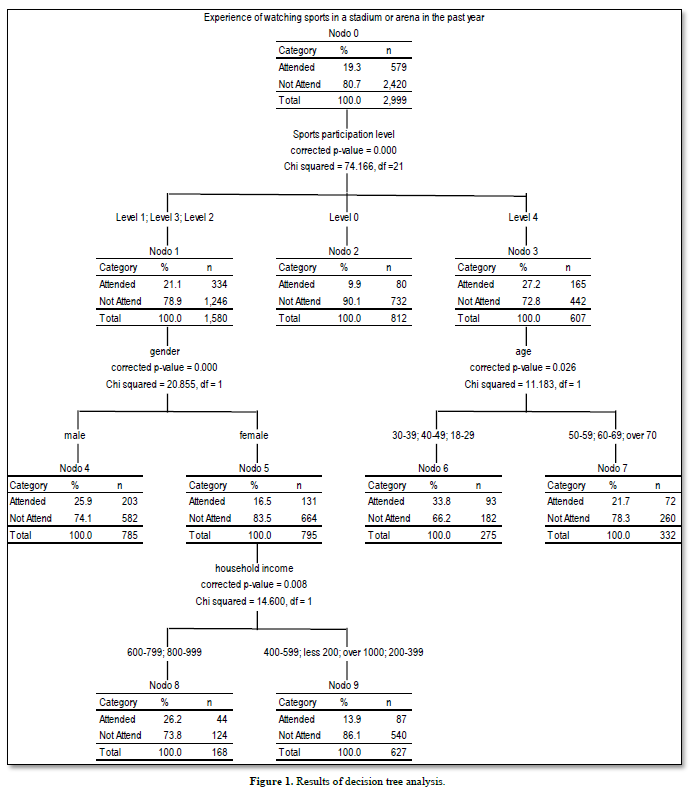
In the segments corresponding to Levels 1, 2, and 3, the next significant factor after the level of sports participation was gender. Among those at Level 1, 2, or 3 who were male, 25.9% engaged in spectating behavior. For females at Levels 1, 2, or 3, household income emerged as an additional significant factor. Specifically, in the income range of 6 million to 10 million yen, the rate of spectating behavior was significantly higher.
The results of the decision tree analysis indicated that sports participation has a significant impact. Previous research has pointed out that sports participation can be both an antecedent [27] and a result of spectating [28]. While this study does not address the causality of sports participation, it suggests that sports organizations should consider leveraging this relationship. Specifically, sports participants under the age of 50 at Level 4, who were found to have high spectating rates, are likely to be a participating member of sports organizations, and utilizing this organized group could be effective in expanding the spectator population.
This decision tree analysis revealed that current sports participation, gender, age, and household income interact with each other and are related to sports spectating behavior. The results suggest that sports organizations aiming to expand their spectator base should identify effective target markets within their spectra tor market, emphasizing the importance of segment marketing.
CONCLUSION
This study revealed that the factors (gender, age, economic status, educational level, residence, and current sports participation) suggested in previous studies in other countries are also related to sports spectating behavior in Japan. Additionally, a decision tree analysis was conducted to distinguish between participants of those who did and did not engage in sports spectating behavior, and identified factors such as sports participation, age, gender, and economic status as the key factors influencing spectating behavior in Japan. The analysis identified current sports participation, gender, age, and household income as significant factors influencing spectator behavior. Furthermore, this study suggests that Japanese sports organizations would benefit from 1). adopting relationship marketing strategies, such as utilizing sports participants as agents to promote sports spectating, and 2). employing segment marketing strategies to target their spectator markets effectively.
LIMITATIONS OF STUDY
This study utilized data from a nationwide survey conducted by the SSF to analyze from a macro perspective, the determinants of spectator behavior among adults aged 21 and over without specifying the sport being watched. As previous studies have noted [10,19] the characteristics of spectators vary significantly depending on the type of sport. Future research will need to analyze the determinants of spectator behavior on a sport-by-sport basis. Such an approach is expected to generate valuable insights that can inform the strategic planning of individual sports organizations.
ACKNOWLEDGMENT
We appreciate the Sasakawa Sports Foundation for allowing us to use the data from the 2022 National Sports-Life Survey as secondary data.


No Files Found


Internationally Accepted
Share Your Publication :