
-
Publish Your Research/Review Articles in our High Quality Journal for just USD $99*+Taxes( *T&C Apply)
Offer Ends On
Publish Your Research/Review Articles in our High Quality Journal for just USD $99*+Taxes( *T&C Apply)
Offer Ends On
Farhat N*, Fadel B and Damirji B
Corresponding Author: Farhat N, The Lebanese Center for Water and Environment, Lebanese University of Lebanon, Beirut, Lebanon.
Received: November 13, 2023 ; Revised: December 03, 2023 ; Accepted: December 06, 2023 ; Available Online: January 04, 2024
Citation: Farhat N, Fadel B & Damirji B. (2023) A Model Based on GIS and Climate-Criteria to Locate Optimal Solar Power Plant Sites. J Agric For Meterol Stud, 2(3): 1-13.
Copyrights: ©2023 Farhat N, Fadel B & Damirji B. This is an open-access article distributed under the terms of the Creative Commons Attribution License, which permits unrestricted use, distribution, and reproduction in any medium, provided the original author and source are credited.
Views & Citations
Likes & Shares
The global energy demand is steadily on the rise, and the increased utilization of fossil fuels has significantly contributed to escalating pollution levels. primarily fueled by the rapid expansion of the world's population. Simultaneously, there is a global shift towards harnessing renewable energy sources, driven by a heightened awareness of environmental preservation. We worked to identify the most suitable zones in southern Lebanon for construction renewable energy power plants according to an innovative and modern methodology that requires integrating Geographic Information Systems with geomorphological and environmental data, in addition to crucial new climate criteria. The selection of these zones is guided by specific criteria and sub-criteria, meticulously defined through remote sensing and a comprehensive review of relevant legal regulations. Then we weigh these criteria based on the percentage of impact on the desired goals, and using spatial analysis tools in geographic information systems, we obtain the optimal places to build these stations. Our findings reveal that climatic and geomorphological factors were the main determinants of the optimal locations for building renewable energy plants. By highlighting the statistical values of the approved standards, it became clear that there are two key factors of additional special importance, namely, cloudiness and elevation, which played a pivotal role in determining the ultimate results. This methodology resulted in a clear change in how to choose the optimal zones to construction renewable energy plants in mountainous areas. It can be used with results in various high-altitude regions around the world that have suitable geomorphological and climatic characteristics that may be somewhat distant from the specific characteristics of the studied area.
Keywords: Electricity deficit, Slope, Economic crisis, Satellite images, Lebanon
INTRODUCTION
Solar cells stand as one of the most pivotal inventions in modern times, aiding humans in fulfilling a significant portion of their daily energy needs by converting solar energy into electric power. The concept of solar cells is ancient, dating back to the early nineteenth century until Russell Ole invented a silicon solar cell in 1941 [1].
Renewable energy is defined as energy derived from sources that are not depleted when used, including solar, wind, geothermal, hydro, and some forms of biomass [2]. In order to control the increase in environmental problems, alleviate climate change [3] that increase global issues such as environmental degradation and global warming [4]. On the other hand, there has been a significant reduction that cannot be ignored in fossil resources reserves, and in 30-40 years, these reserves will be unable to meet the needs of the World [5], while Renewable energy sources come from nature and can be renewed, and its aim is to protect our Earth, but it also leads to an increase in local and regional development as well as an increase in the employment of the population [6].
Today, solar photovoltaic energy is experiencing global growth. In Lebanon, the inaugural solar energy project in Lebanon was located on the Beirut River, boasting a capacity of 1 MW. The adoption of solar energy is seen as a crucial step for Lebanon to overcome its chronic energy shortage. It is considered the most pragmatic move, paving the way for a transition to renewable energy sources [7]. Notably, Lebanon experiences 300 days of sunshine per year; however, less than 1% of the power provided by the state is derived from solar energy [8].
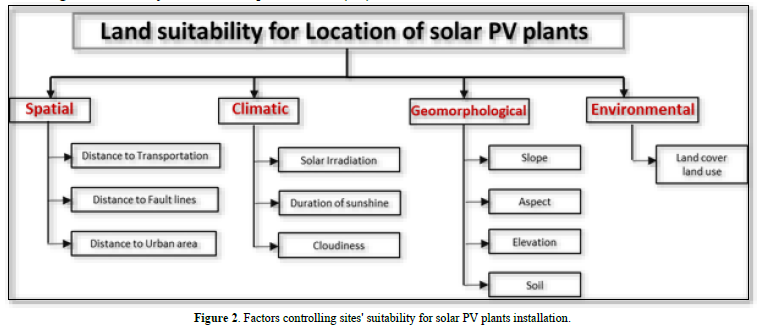
The efficiency of utilizing renewable energy hinges on various natural characteristics and numerous parameters. These factors can be discerned through the application of remote sensing techniques, serving as a tool to extract the necessary geospatial data for analysis using GIS applications. The primary goal of this study is to identify the geographic distribution of the most suitable sites for installing photovoltaic (PV) systems in the Nabatieh District. The CGES (Climate Geomorphological Environmental Spatial) method was employed to assess which sub-factors signify the suitable location for the installation of solar power (SP). The CGES method is essentially a combination of tools executed within ArcGIS Pro 2.5, utilized to apply this method and achieve the study's objectives.
MATERIALS AND METHODS
Study Area
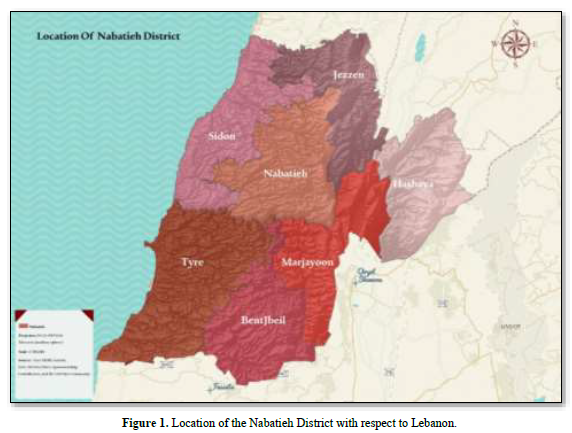
The study area is one of the four districts of the Nabatieh governorate (Hasbaya, Marjaayoun, Bent Jbel, Nabatieh), specifically Nabatieh District, situated in the middle of the south and eastern sectors of Lebanon. It is bordered by the Marjayoun district to the east, the Jezzine district to the north, Tyre and Bint Jbeil to the south and east, and Sidon-Zahrani to the west (Figure 1).

The study area lies between the geographic coordinates: longitude of 35° 28' 50" E and a latitude of 33° 22' 44" N with a total area of about 308 km². Nabatieh city is the center of the district and the center of the government, it includes 52 municipalities.
Materials Used
Geo-processing technology
Geographic Information System (GIS)
GIS (Geographic Information System) is an integrated real-world information system that has been condensed and organized into a digital database comprising both spatial and non-spatial features. This system is augmented by specialized software and hardware, and it involves the expertise and judgment of users, experts, or analysts. The study employs ArcGIS Pro 2.5 software, developed by ESRI (Environmental System Research Institute, Redlands, USA). ArcGIS facilitates the handling and analysis of geographic information by visualizing geographical statistics through the creation of layer-based maps and conducting overlay analyses. It operates on the principle of collecting thematic layers of data linked by geography or spatial data, each layer containing various vector features that can be analyzed using GIS tools and visualized as maps.
Data sources
To generate solar power plant suitability maps, it is beneficial to employ more innovative and multi-criteria analysis techniques. In this study, the primary data sources included satellite images from Sentinel Level-2A with a spatial resolution of 10m. The spatial database comprised shape files (such as Road, RSoil, Land cover / Used (LCLU), slope, aspect, elevation, Faults lines, Distance to Urban Area.) relevant to the study. Additionally, mission data from STRM (Shuttle Radar Topography Mission) obtained from USGS (United States Geological Survey) with a spatial resolution of 30m was used. Some shape files were sourced from NCRS (National Center for Remote Sensing) and pertained to essential data for Lebanon, including soil type and land cover/land use data for the year 2017. The mapping utilized a fixed scale of 1/500,000 and employed the WGS 1984 UTM Zone 36N projection. Method of data analysis.
Identification of factors and sub-factors
The methodology employed in this study drew inspiration from previous research and leveraged existing datasets, along with the expertise of the authors. Consequently, the initial step involved identifying the principal factors influencing the suitability of sites for photovoltaic (PV) plants. The selection of these factors can vary across different regions. In the Nabatieh District, four key factors were delineated: climatic, geomorphological, spatial parameters, and land use. Each of these factors was further subdivided into specific sub-factors for a more detailed analysis (Figure 2).

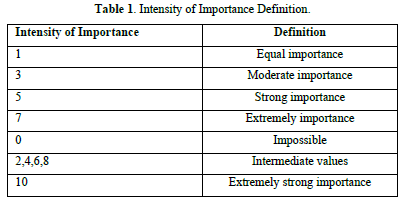
For suitability analysis, it is important to assign relative value weighted to each requirements of the sub-criteria as per their relative importance in achieving the best sites. The value is defined as below (Table 1).

The CGES method is essentially a combination of tools executed within ArcGIS Pro 2.5, utilized to apply this method and achieve the study's objectives. Initially, each sub-factor is precisely defined, as mentioned earlier (Figure 2).
In the second step, each sub-factor was categorized into several values, each representing the level of impact on solar power (SP). These classifications are presented in vector format, where higher values indicate better suitability for SP (Table 1). In this methodology, the criteria utilized are widely employed in all similar studies to determine the localization of solar power. However, each country possesses distinct features compared to others. Consequently, certain criteria may be added or removed, affecting the classification of values based on the study area's location and categorization.
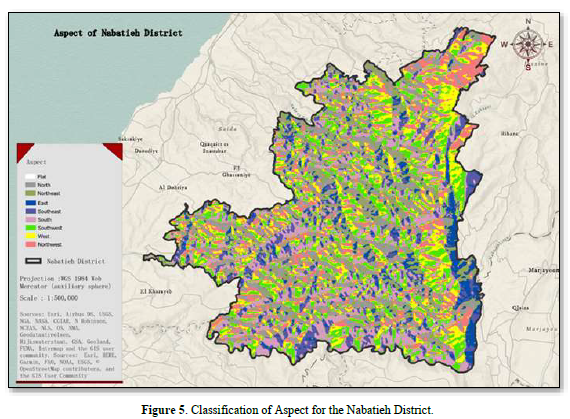
For the aspect sub-factor, maximizing solar irradiation leads to higher electricity generation by solar cell modules. Hence, it is crucial to install photovoltaic (PV) systems in locations that receive optimal sunlight throughout the year, with special consideration for winter when the days are shorter than nights. Nine directions were selected for analysis: Flat, SE (Southeast), S (South), E (East), SW (Southwest), NW (Northwest), N (North), and NE (Northeast). Each direction plays a distinct role in sunlight irradiation retrieval.
Aspect
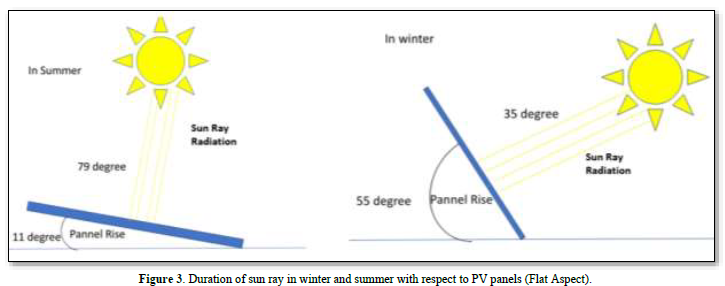

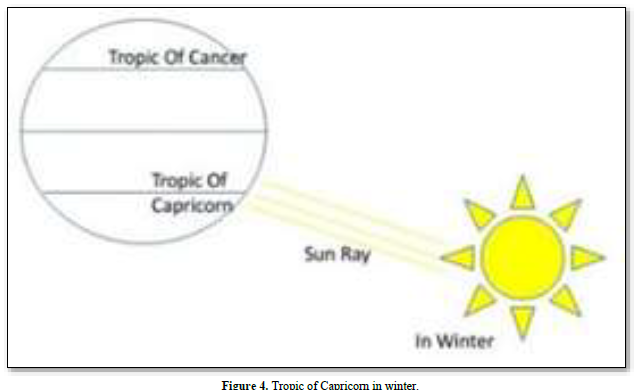
Note: The Tropic of Capricorn is an imaginary line of latitude going around the Earth at approximately 23.5° south of the equator. It is the southernmost point on Earth where the sun's rays can be directly overhead at local noon. It is also one of the five major circles of latitude dividing the Earth (the others are the Tropic of Cancer in the northern hemisphere, the equator, the Arctic Circle and the Antarctic Circle) [10].

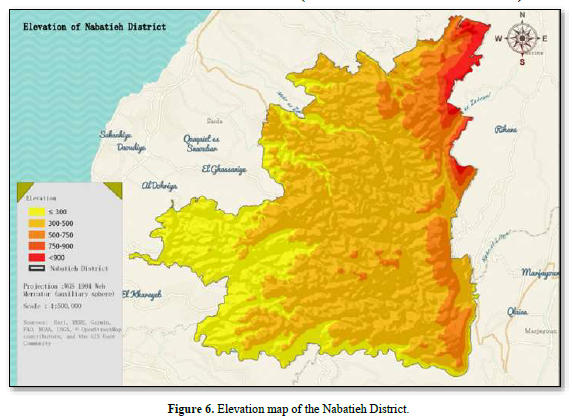
Elevation
Elevation holds significance in the selection of photovoltaic (PV) sites, especially considering its relationship with cloudiness, particularly in mountainous areas. In elevated regions, the condensation of water vapor is higher, leading to the formation of cloud layers that can obstruct the sun's rays [11]. Consequently, this results in reduced solar energy availability. Lower areas are generally better suited for solar energy production due to the reduced impact of cloud. The value has been classified in meters regarding the study area categories. We have different levels of elevation, and this criterion plays a big role in determining the final results (Error! Reference source not found.).

Slope
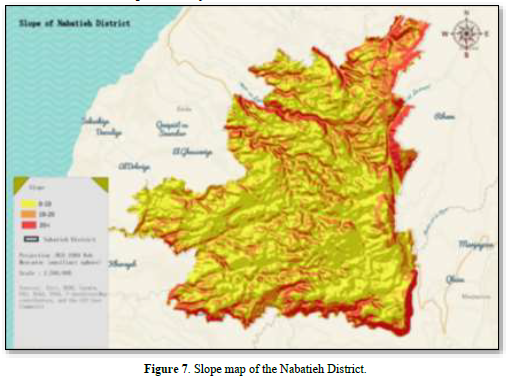
The classified values regarding the study area categories, influenced by different levels of elevation, play a significant role in determining the final results. The slope value classifications were determined due to the importance of this criterion and the study area location. In the context of photovoltaic (PV) installations, the slope, measured as the decline from a horizontal surface, plays a crucial role. A steep slope can impact construction costs, particularly when adjusting the panel's direction toward the sun, leading to higher expenses for construction and maintenance on steeper slopes. Moreover, the optimal orientation and inclination of PV systems are influenced by the slope. The classification of slope values in degree was particularly crucial due to the significance of this criterion and the specific characteristics of the study area location. In cases where the slope is low, the orientation becomes less critical, making such areas more suitable for PV (Figure 7) [12].
Soil
Soil types must be taken into consideration while installing PVs. This is in order to avoid erosion and its effects. When there is permeability, it prevents flooding, while when there is non-permeability, it becomes heavy, which leads to the drifting of the soil. According to Colunga [13] this data has been processed accordingly (Figure 8).
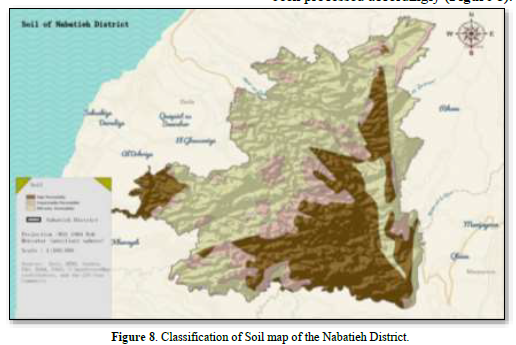
Soil type is also affecting the solar cells in that soil dust can make a seal and prevent solar radiation from completely reaching the cell. Therefore, in friable and unconsolidated soil material areas, PV will be under such a problem.
Roads network
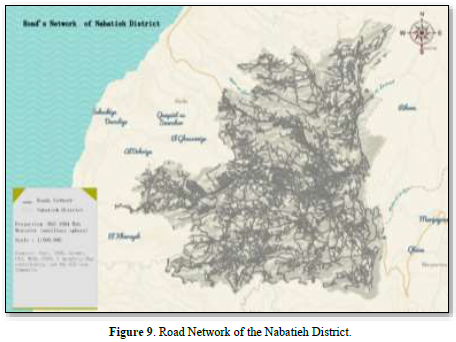
The proximity of roads to photovoltaic (PV) sites is a significant factor to consider. The closer the site is to existing roads, the less expensive and environmentally damaging it is to construct new roads for access. However, it is advisable to maintain a distance of not less than 50 meters from the road to prevent issues related on the arrival of solar irradiation to the panels, which can be caused by dust generated by passing vehicles (Figure 9).
Land cover
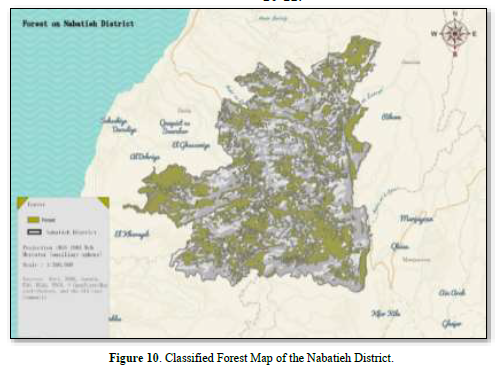
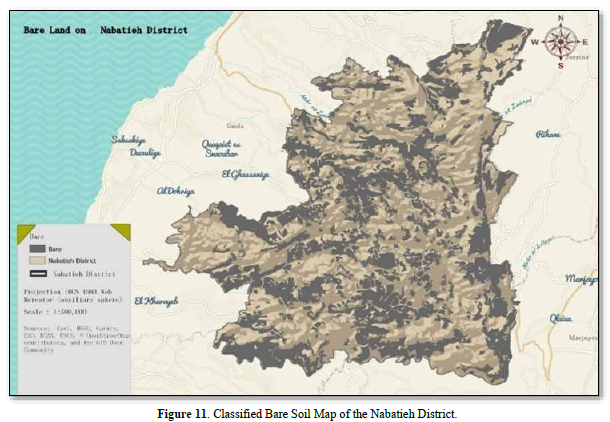
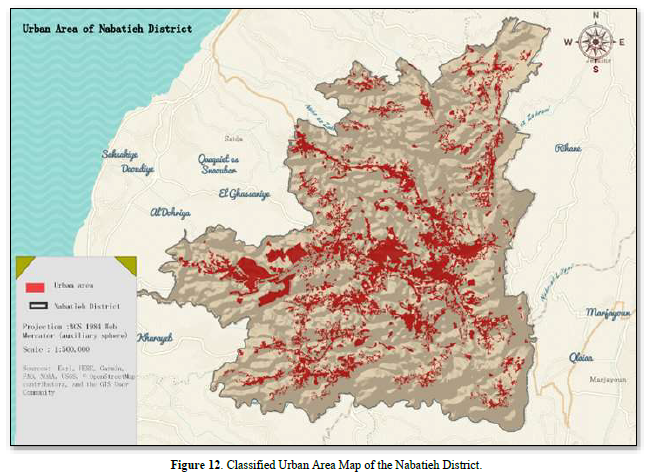
In the context of land cover, a suitable area for photovoltaic installations should be free of natural obstructions such as forests, high buildings, water bodies, or any constructions that could potentially block sunlight from reaching the panels. It is preferable to avoid proximity to human settlements to minimize the risk of shading. The maps are typically classified into three categories, which are Figures 10-12.

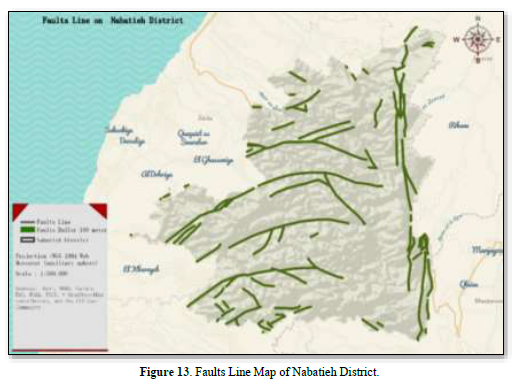
Finally, faults were considered to let the PV away from it at a distance to avoid the impact of the earthquake (Figure 13).
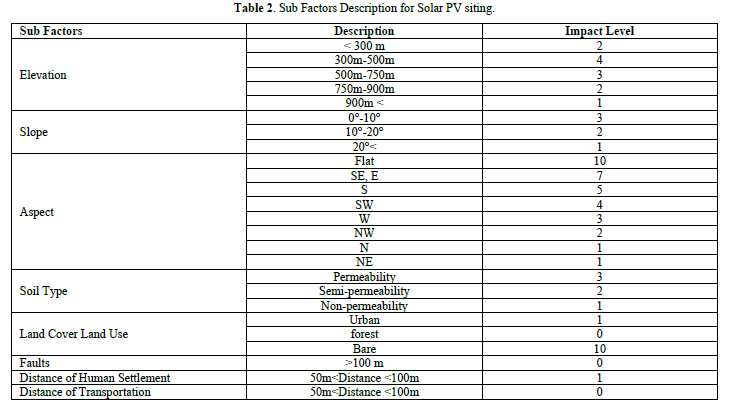
In the final step, the tools under the CGES method were applied based on the sub-factor values to achieve the optimal location for solar power (OLSP) stations. The influencing factors mapped under CGES exhibit a diverse range of classes, which are either represented by numerical values (e.g., slope and elevation) or in descriptive forms (e.g., soil type, aspect, etc.) (Table 2).
Using ArcGIS Pro 2.5, the classifications of each point are determined, establishing the main value for each sub-factor. Data management tools and overlay tools are employed to overlay all the map layers. Subsequently, these layers are weighted and ranked based on their importance and their respective effects on solar power (SP) to generate the final result map.
RESULT AND DISCUSSION
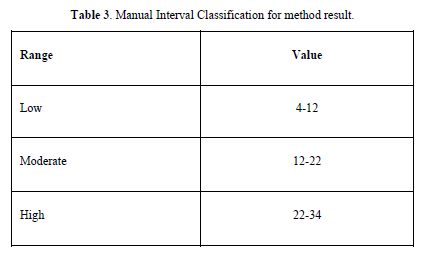
The results were obtained in two major phases in accordance with the method of the study and the eleven sub-factors mentioned (Error! Reference source not found.). The result map, which was deduced from the CGES method, was prepared and classified into three classes based on manual interval classification, which works by defining the different classes that we have, manually adding class breaks, and setting class ranges that are appropriate for the data, which ranged from low, moderate, and high classes (Error! Reference source not found.).

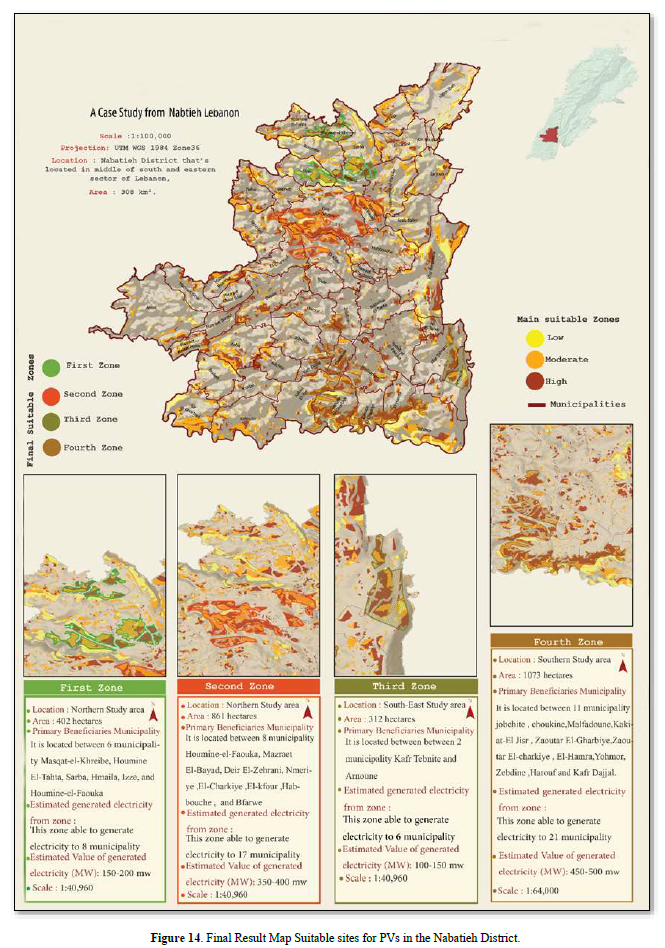
The result has been determined according to a two-phase process. First, the overall main result, which determines all the optimal locations for installing SP stations that consider low, moderate, and high classes; then, by making a visual analysis to determine the second step, which determines the final map of the study, which considers just the acceptable zones for the installation of SP stations. Considering the classes of moderate and high and the area of more than 50 hectares, to be able to generate electricity for a district or a city, we estimate that we need about 25 megawatts, which is an estimated area of 50 hectares according to tip [14] each 1 MW needs 2 hectares of area.
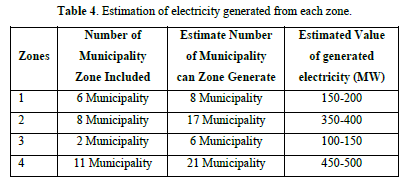
Through this analysis, it was determined that there are four clusters of ideal locations within this area suitable for establishing a solar power plant. are considered to install SP stations in the Nabatieh District.
The suitable zones for SP: In Figure 14, the shown result was categorized into four zones, each represented by a distinctive hatching in the colors Olive, Green, Orange, and Bronze they are determined due to the areas and the location of it.
If we present the area of each zone and the number of municipalities that they pass, the electricity that may be generated is enough to cover all these Municipalities, and may the surrounding Municipalities benefit from it (Error! Reference source not found.).


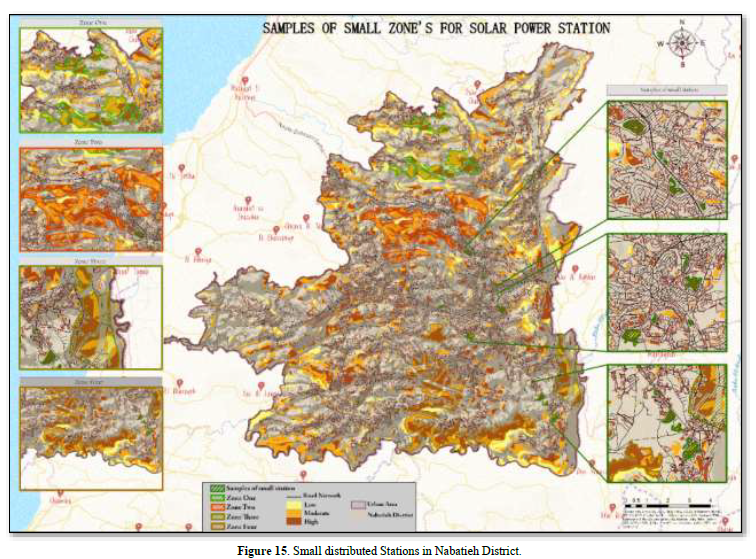
The second phase of the result was determines presented as distributed zones where SPs can be built with small-scale solar power stations. These stations can be used in many small projects that need electricity, like car recharging stations.

In Figure 15, the small zones depicted on the right side of the map, marked with green hatching, represent the suitable areas for the small stations in the study area. On the left side, the primary results of the study regarding the four main zones have also been arranged to visualize the location of all suitable areas.
CONCLUSION
The application of the CGES Method in determining the locations of solar power plants has proven to be a precise and effective method. Based on the analysis conducted, the study area demonstrated significant potential for the development of these technologies, considering various criteria and sub-criteria factors. This study focused on selecting the most suitable zones for solar power plants using spatial analysis, geographic, and climate data in different layers. The examination revealed that the most influential factors affecting the results were cloudiness and elevation. In mountainous regions, clouds tend to accumulate at the peaks, resulting in an additional two hours of sunlight blockage compared to lower elevations during the summer. Additionally, in winter, it is possible for clouds to obscure the entire day. Therefore, it became evident that the higher the elevation, the weaker the production of solar panels, especially when situated at the feet of high mountains.
This approach will enable the mountain areas to contribute significantly to identifying the challenges faced by the solar power station projects and contributing to creating a healthier environment.


No Files Found


Internationally Accepted
Share Your Publication :