
-
Publish Your Research/Review Articles in our High Quality Journal for just USD $99*+Taxes( *T&C Apply)
Offer Ends On
Publish Your Research/Review Articles in our High Quality Journal for just USD $99*+Taxes( *T&C Apply)
Offer Ends On
Daniel Markos*, Walelign Worku and Girma Mamo
Corresponding Author: Daniel Markos, Hawassa University, School of Plant and Horticultural Sciences, P.O. Box-05, Hawassa, Ethiopian Institute of Agricultural Research, P.O. Box-2003, Addis Ababa, Ethiopia.
Received: April 21, 2023 ; Revised: May 15, 2023 ; Accepted: May 18, 2023 ; Available Online: June 28, 2023
Citation: Markos D, Worku W & Mamo G. (2023) Performance Evaluation of Selected Maize Varieties using DSSAT Crop Simulation Model under Various Production Environments. J Agric For Meterol Stud, 2(1): 1-12.
Copyrights: ©2023 Markos D, Worku W & Mamo G. This is an open-access article distributed under the terms of the Creative Commons Attribution License, which permits unrestricted use, distribution, and reproduction in any medium, provided the original author and source are credited.
Views & Citations
Likes & Shares
Background and Objective: Maize is an important crop in Ethiopia because of its adaptation to wider agro-ecologies and higher yield potential. However, most varieties were not parameterized regularly, and not included in the database of Decision Support System for Agro-technology Transfer (DSSAT), due to which simulation of growth and yield of the varieties was not possible under changing climate. Hence this experiment was conducted to determine the genetic coefficients of maize cultivars adapted to the southern central rift valley of Ethiopia and to simulate the growth and yield of maize under various rainfed production environments using the DSSAT model.
Materials and Methods: The DSSATv4.8 was calibrated using genotypic, edaphic and historic weather parameters. Later, the model was tested for its performance through a validation procedure using the second set of independent data. The performance of five maize varieties grown across Shamana, Bilate, Hawassa and Dilla areas were simulated. The output of the model was statistically analyzed to evaluate the impact of climate change on maize production.
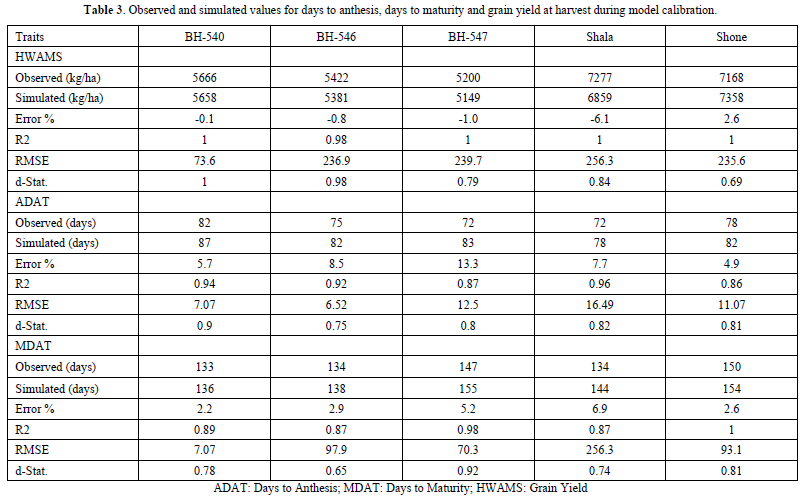
Results: The varieties BH-540, BH-546, BH-547, Shala and Shone produced yields of 5658, 5381, 5149, 6859 and 7358 kg/ha with the percentage errors of -0.1, -0.8, -1.0, -6.1 and 2.6%, respectively. This shows good agreement within the statistical significance limit (P<0.05) between observed and simulated yields. Simulation experiment produced 7620.8 kg/ha at Shamana for Shala variety, and 5383.9, 9206.3 and 5973.6 kg/ha at Bilate, Hawassa and Dilla, respectively for Shone variety.
Conclusion: It can be inferred that the DSSAT version 4.8 can be successfully employed for simulating the growth and yield of maize hybrids including climate change impact analysis in the southern central rift valley of Ethiopia.
Keywords: Calibration, DSSAT Model, Maize, Simulation and validation
MAJOR ACHIEVEMENTS
The error percentage was least for grain yield parameter, intermediate for days to maturity and largest for days to anthesis.
INTRODUCTION
Assessment of crop yield response to climate risks is commonly carried out using either machine learning, regression, or process-based tools [1]. Since recently process-based models are being used to simulate crop development and production by integrating genotypic, environmental, and management information [2] into a comprehensive expression. The same is used to evaluate the impact of climate on crop production as a result of increased greenhouse gases [3], and to generate adaptation responses for sustained agricultural production [4]. One of the contemporary support tools is DSSAT; a set of independent programs that operate simultaneously in simulation models using soil, climate, crop, and agronomic management databases [5,6]. In Ethiopia, improved technology and decision support tools (DSTSs) have been in use over the last couple of decades in the interest of improving agricultural productivity under varying climate scenarios [7-11]. However, the progress in using crop models has been slow for use in agronomic studies and accurate simulation of crop production for different agro-ecological conditions due to the complexity of the relevant biophysical processes, associated sources of uncertainty [8], and the scarcity of relevant datasets [1].
To direct the use of crop-climate modeling research, broadening the knowledge base in site-specific calibration and validation of processes, including the determination of crop cultivar-specific genetic coefficients for evaluating crop models has invaluable significance in the DSSAT model [12]. These genetic parameters are sets of values that enable crop models to simulate the performance of diverse genotypes under varying soil, weather and management conditions more precisely. Estimation of the coefficients is the most intricate aspect of modeling exercise simply due to the requirements of expensive and time-consuming field experiments [13]. However, it is demanding to establish the Genotype Specific Parameters (GSPs) before applying the cropping system model to obtain credibility and the ability in simulating crop growth and yield. There exist endeavors that resulted in cultivar coefficients for some maize varieties in Ethiopia [7,9,11]. However, cultivars parameters were not determined for other maize varieties grown particularly in the southern central rift valley. Hence, there is a strong call for the calibration of the DSSAT maize model through cultivar coefficients, while there is also a need for new cultivars to be updated or parameterized regularly in the crop models [14]. Since the accurate estimation of crop cultivar coefficients is the entry point for use of dynamic crop model, identification of knowledge gaps and improvement of our wisdom over crops and biophysical aspects helps for narrowing the breach, enhancing decision making, and subsequent augmentation of agricultural productivity. Calibrated crop models with cultivar parameters can be used to optimize crop management, evaluate the impacts of climate change, to develop options that optimize resource use [2-4].
Using the GSPs, which provide the genotype component of G×E×M interactions, estimation of multi-year and multi-location data from breeder evaluation experiments across varied agro-climatic conditions as possible [5,6,13]. In practice, the cultivar coefficients carry genetic, phenological, and physiological information of a particular crop variety; thus, allowing simulations on a daily step or in some cases, at an hourly time step depending on the process and the crop model. At the end of each day and with the progressing growing season, the plant and soil water, nitrogen, phosphorus, and carbon balances are updated, as well as the crop’s vegetative and reproductive development stages are restructured [12]. Subsequently, the DSSAT model simulates growth, development, and yield as a function of GSPs, weather and soil conditions, and crop management choices. The genetic inputs are PHINT (thermal time between the appearance of leaf tips), G3 (kernel filling rate), G2 (potential kernel growth rate), P1 (Thermal time from seedling emergence to the end of the juvenile phase), P2 (measures development about photoperiod), P5 (measures the thermal time from silking to physiological maturity) [5,6]. It is recognized that soil water remains the most important variable affecting the development rate during germination, and temperature becomes the primary variable influencing growth and development after germination [15]. Moreover, shoots have a higher priority than roots for assimilation as long as the nutrient and water supply from the soil is sufficient during vegetative growth. Conversely, roots will have higher priority, if water or nutrient is deficient. The grains are the main sink for assimilation during the grain-filling period. Materials for filling the grains can be from current photosynthesis or stored assimilate. If crop growth conditions with unlimited water and nutrients exist, then the growth rate is determined only by the weather. Thus, the CERES (Crop Environmental Resource Synthesis) model, which is a component of the Decision Support System for Agro-Technological Transfer (DSSAT), offers an opportunity to explore the potential of new varieties and crop management practices in different environments (soil, climate, and management) before their release through analysis of growth duration, growth rate, and the extent to which stresses influence these processes [15]. As a result, a user can simulate crop growth, development, and yield for different maize varieties by making only minor changes to the input files that are cultivar-specific [16]. Keeping these imperatives in view, the present study was undertaken to determine the genetic coefficients of maize cultivars adapted to the southern central rift valley of Ethiopia and to simulate the growth and yield of maize under various rainfed production environments using the DSSAT model.
MATERIALS AND METHODS
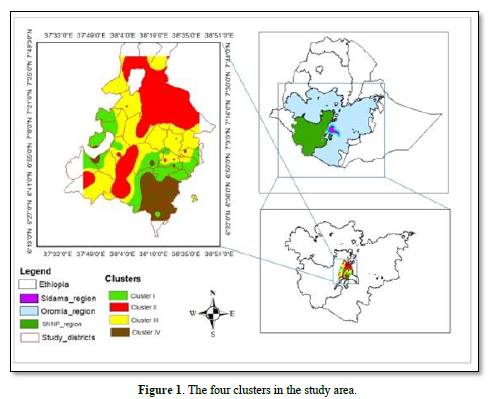
The study area
This study was carried out in southern plains of Central Rift Valley of Ethiopia, located between 6.38 latitudes in Dilla area (South) to 7.72 latitudes in Bulbula area (North). The Western margin corresponds with 37.75 longitudes (Wolita sodo) to 38.68 latitudes in Woteraresa (East). This covers an area of 1,021,332 ha (Figure 1).
DSSAT (CERES-Maize) Model
DSSAT was developed by an international network of scientists, cooperating in the International Benchmark Sites Network for Agrotechnology Transfer Project. DSSAT version 4.8 was used in this study. The DSSAT simulate crop growth, development and yield using a defined data set on crop management, minimum weather data and soil profile parameters. Some of the crop management data required to calibrate DSSAT model takes account of crop, cultivar, planting date, row and plant spacing, fertilizer-N levels, tillage practices and organic amendments [5,6]. Also, data includes inputs on physiological stages of crop growth such as flowering dates and days to maturity. Minimum weather data sets consist of maximum and minimum temperatures, solar radiation and rainfall. Soil profile parameters comprise depth of soil, soil physical and chemical characters. The crop management data were recorded throughout the growing seasons. The input files, such as weather file, soil file, experimental file and A & T files (average measured data file, annual as well as temporal), were prepared to calibrate and validate the Crop Environment Resource Synthesis (CERES)-Maize model. All these input files are integrated into CERES-Maize system, a limited part of a reality that contains interacting elements [17].
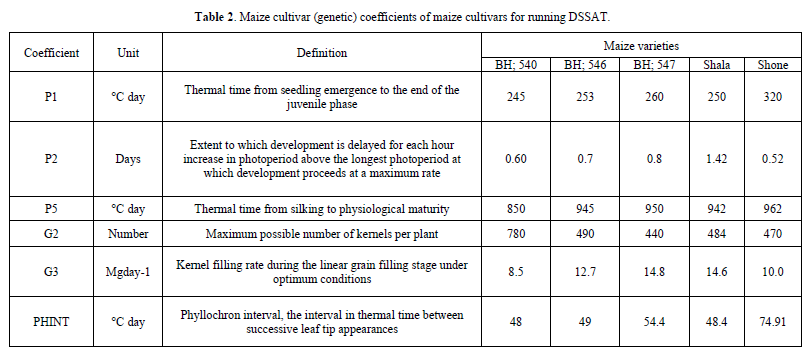
CERES-Maize model is a simplified component of DSSAT system that is predictive and deterministic model designed to simulate maize growth, soil, water and temperature and soil nitrogen dynamics at a field scale for one growing season. The CERES-Maize model in DSSAT requires a set of six cultivar specific parameter for its calibration (Table 1). Four of them (P1, P2, P5, and PHINT) control the timing of phenological stages, and the remaining two (G2 and G3) characterize the potential yield under optimal conditions. By running Generalized Likelihood Uncertainty Estimation (GLUE), iteration and simultaneous carrying out sensitivity analyses, the coefficients for the tested cultivars were computed for use in the process of calibration.
Determination of genetic coefficients
The DSSAT crop model calibration requires genetic coefficients, which are specific for each cultivar to properly describe the processes related to growth, development and grain production under different soil, weather and management conditions. The cultivar coefficients for BH-540 and BH-546 were adopted from works of Mohammed [7], Kassie [11] and Liben [9], respectively as shown in Table 2. However, the genetic coefficients for BH-547, Shala (P2859W) and Shone (PHB30G19) were not previously introduced within DSSAT due to which the genetic file (MZCER048.CUL) of DSSAT-CSM was created. Initial values of the genetic coefficients were obtained from the medium maturity group cultivar BH-546, already available in the DSSAT to modify and use for BH-547. As Shala and Shone varieties are pioneer hybrids, the file for medium maturing pioneers (e.g. PIO-3183) was selected and used by modifying it for the new varieties. The computed crop specific parameters (CSPs) for BH-547, Shala and Shone varieties were copied into MZCER048 CUL file to operate the simulation. An iterative approach was used to obtain reasonable genetic coefficients through trial and error adjustments until there was a match between the observed and simulated dates of anthesis and physiological maturity and grain yield [21]. The derived genetic coefficients were used for model performance evaluation of maize varieties.

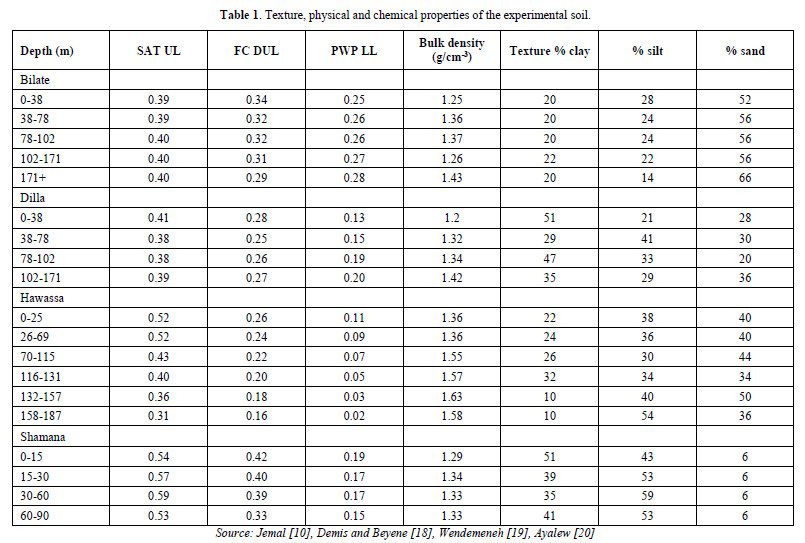
Soil characterization
The soil data were collected and stored in the soil input file. The soil texture, bulk density, soil moisture, pH, organic matter, total N, field capacity, wilting point, and saturated moisture content were captured for each cluster following Table 1. The top soils of the experimental sites were specified as clay loam, sandy, sandy loam and silty clay in Shamana, Bilate, Hawassa and Dilla clusters, respectively.
Weather Information
Daily weather data of the growing seasons, including precipitation (mm), minimum and maximum air temperatures (°C), and sunshine hours were collected from different sources including the Ethiopian Meteorology Institute (EMI) Hawassa Branch office and Hawassa Agricultural Research Center (HARC). In the absence of meteorological stations data, Climate Hazards Group Infra-Red Precipitation with Stations (CHIRPS) satellite rainfall data (https://data.chc.ucsb.edu/products/CHIRP S-2.0/) were used [22,23]. Solar radiation (MJ m−o d−o) was derived from daily sunshine hours by using Weatherman of DSSAT. The weather files were created by using WEATHERMAN module of DSSAT for running of the model.
Model Calibration
The model was calibrated using field measured values of weather parameters, crop management and soil properties during 2014-2015 cropping season. Genetic coefficients were estimated by using observed days to flowering, days to physiological maturity and grain yield of maize cultivars growing in 2013-2017 as reported in Mekasha [24] and Sorsa [25]. Comparisons between measured and predicted maize yield and its attributes were carried out using RMSE, d-statistic and R2 as shown in equation 1, 2 and 3 [26].
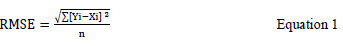
where Yi and Xi are the simulated and observed values respectively and n is the number of observations. Small values of RMSE considered as indicators for good performance of the DSSAT model. The second criterion was the determination of index of agreement or d-statistic [27]. It is used to measure the degree of the model prediction error, and the following Eq. 2 was used:
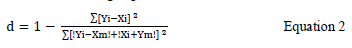
where Yi, and Ym are simulated and mean of the simulated yield respectively. Similarly, Xi and Xm are observed yield and mean of observed yield, and n is the number of observations. The d values range between 0 (no agreement) and 1 (perfect fit). Small values of d are considered as good performance of the DSSAT model [28]. The third criterion was determining the correlation coefficient (r) value. It is used to evaluate the linear relationship between the observed and modeled amounts with a value of 1.0. Thus, r tests the ‘‘goodness of fit’’ of the linear model, r = 1 indicates a perfect fit of the model and r = 0 indicates that there is no linear relation.
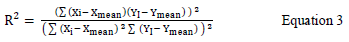
where n is the sample number, Xmean and Ymean are the observed mean and simulated mean values, respectively. Xi and Yi are the observed and predicted values of the ith observation (i = 1 to n), respectively. For RMSE, values closer to zero imply a good fit between observed and simulated yields. A value of zero for RMSE means that the model predicts the observations with perfect accuracy. The coefficient of determination, R2, values range between 0 and 1, with 0 indicating “no fit” and 1 indicating “perfect fit” between the simulated and observed values, with higher values indicating less error variance. The RMSE values closer to 0 indicate better agreement between the simulated and observed values.
Model Validation
Model performance was evaluated by comparing the simulated versus observed values from the experimental data of 2016-2018 as reported in Bejigo [29], Loha and Hidoto [30] and Hidoto [31]. The comparison of observed and simulated data on anthesis date, physiological maturity date and grain yield was carried out by analyzing the results from Equations 1, 2 and 3, mentioned above.
Simulation experiment
Past and present CERES-Maize calibration and validation for major cultivars for Ethiopian production environment opens the way for use of the DSSAT model for inputs and resource management, yield forecasting and climate change impact analysis. Performance of five maize varieties (BH-540, BH-546, BH-547, Shala and Shone) commonly grown across four locations (Shamana, Bilate, Hawassa and Dilla) was simulated using the cultivar parameters of each genotype, edaphic conditions and historic weather for each location. For this experiment, commonly known dates of planting (18th January for Shamana, May 1st for Bilate, April 20th for Hawassa and March 20th for Dilla), nitrogen application (92 kg N for Shamana, 46 kg N for Bilate, 92 kg N for Hawassa and 69 kg N for Dilla), conventional tillage method and population (5.33 plants m2) were used. The simulation experiment was run under water and nitrogen limiting conditions for rain-fed farming using 380 vpm CO2 emission (as default value) with thirty years (1991-2020) historic weather run across thirty years serving as replications.
Statistical Analyses for simulation experiment
The outputs of DSSAT model for dates of anthesis and maturity, and grain yield at harvest were statistically analyzed using the analysis of variance (ANOVA) technique to evaluate the impact of climate change on maize production. Accordingly, the five varieties were evaluated across four locations for each GHGs emission scenario during baseline, early, mid- and late century. The year effect, which has 30 levels, was used as replications (blocks) as in the DSSAT software because the maize yield in one year under a given treatment was not affected by another year. Since each simulation year had unpredictable weather conditions, formal randomization of simulation years was not needed [32]. The ANOVA was calculated using the SAS software package and treatments averages were separated using least significance difference (LSD) at 5% level of probability wherever difference between averages exist.
RESULTS AND DISCUSSION
Genetic Coefficients
The genetic coefficients, as obtained through running GLUE as part of calibration exercise, were shown in Table 2. The genotypic coefficient P1 was 245, 253, 260, 250 and 320°C day for BH-540, BH-546, BH-547, Shala and Shone varieties of maize, respectively, while the P2 was 0.60,0.7, 0.8, 1.42 and 0.52 days for the same maize varieties. Thus, Shala variety required more thermal time from seedling emergence to the end of the juvenile phase compared to other maize varieties considered in the study. The genetic coefficient P5 was 850, 945, 950, 942 and 962°C day for BH-540, BH-546, BH-547, Shala and Shone maize varieties, respectively. G2 was 780, 490, 440, 484 and 470 whereas PHINT was 48, 49, 54.4, 48.4 and 74.1 forBH-540, BH-546, BH-547, Shala and Shone varieties of maize, respectively. There was considerable variation among the cultivars in G2 and G3 but PHINT were the same amongst the cultivars. Thus, variety BH-540 has the highest maximum possible number of kernels per plant but showed up with low productivity mainly because of lowest kernel filling rate during the linear grain filling stage under optimum conditions, compared to other varieties. PHINT is critical in determining the duration of vegetative growth in maize, which is lower in temperate but higher in tropical climate. The difference in genetic coefficients justifies variation in the rate of development and accumulation of dry matter [33], and could be attributed to the differentiation in vernalization characteristics, photoperiod response, duration of grain filling, phillochron interval, and number of grains per ear, spike number umber of grains per ear and spike number umber of grains per ear, spike number umber of grains per ear and spike number of each variety [33].
The highest PHINT values (74.91°C) observed in Shone variety were indicator of largest interval in thermal time between successive leaf tips, which gives maximum potential to fix growth and yield components during development of vegetative infrastructure due to slow leaf emergence. The adopted and generated cultivar specific parameters were within the range of DSSAT cultivar database. So, we can use the generated genetic coefficient in model application for southern central rift valley of Ethiopia.
Phenology and grain yield at harvest during calibrations
During calibrations, days to flowering for BH-540, BH-546, BH-547, Shala and Shone were 87, 82, 83, 78 and 82 with error percentage of 5.7, 8.5, 13.3, 7.7 and 4.9%, respectively (Table 3). The days to maturity averaged across study sites were 136, 138, 155, 144 and 154 with error percentage of 2.2, 2.9, 5.2, 6.9 and 2.6, respectively. The obtained grain yields were 5658, 5381, 5149, 6859 and 7358 kg ha-1 with error percentage of -0.1, -0.8, -1.0, -6.1 and 2.6 for BH-540, BH-546, BH-547, Shala and Shone, respectively. Thus, the error percentage was least for grain yield parameter, intermediate for days to maturity and largest for days to anthesis. There was slight underestimation of grain yield for BH-540, BH-546, BH-547 and Shala by the model as shown with negative error percentages and there was slight overestimation of grain yield for Shone variety (Table 3). However, the performance of the model after its calibration was satisfactory and the results were within significant limits and in conformity to the results of Mohammed [7], Feleke [8], Kassie [11] and Liben [9]. The under estimation of grain yield found in this study was in line with findings of many authors including López-Cedrón [34], who indicated that the DSSAT model underestimated the maize yield partially because that the simulated water extraction was earlier than field experiment under water deficit condition.
Phenology and grain yield at harvest during model validations
During validations, days to anthesis for BH-540, BH-546, BH-547, Shala and Shone were 81, 75, 72, 72 and 78 with error percentage of 1.2, 7.4, 11.1, 7.7 and 4.9%, respectively (Table 4). The days of maturity averaged across study sites were 143, 134, 143, 142 and 144 with error percentage of 7.0, 6.0, -2.8, 5.6 and -4.2, respectively. The obtained final grain yield was 5556, 5310, 5872, 7474 and 7358 kg ha-1 with error percentage of -6.0, -8.8, -2.9, -11.0 and 2.6 for BH-540, BH-546, BH-547, Shala and Shone, respectively. Thus, the error percentage was least for grain yield parameter, intermediate for days to maturity and largest for days to anthesis.
Days to flowering
The validation results showed that days to anthesis were 82, 81, 82, 78 and 81 for BH-540, BH-546, BH-547, Shala and Shone varieties with the goodness of fit (R2) values of 0.82, 0.92, 0.90, 0.95 and 0.95, respectively between observed and simulated estimates.
Days to maturity
The goodness of fit (R2) between observed and simulated data was 0.96, 0.94, 0.88, 0.92 and 0.89 showing error percentage of 7.0, 6.0, -2.8, 5.6 and -4.2 for varieties BH-540, BH-546, BH-547, Shala and Shone, respectively (Table 4). In fact, the model has over estimated days to maturity in BH-540, BH-546 and Shala varieties, and underestimated in BH-547 and Shone varieties. The overestimation has also been reported by Feleke [8] for late-maturing varieties at Ambo using the DSSAT CERES-maize model.
Grain yield at harvest
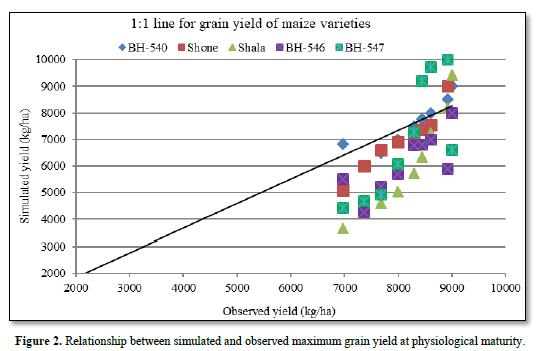
The regression line for grain yield was more or less near to 1:1 line, indicating that the model was performing well under the test environment for BH-547 and BH-540 maize varieties. Thus, most data falling close to a 1:1 line between simulated and observed data (Figure 2), which indicated only a few days of error. However, for varieties Shone, Shala and BH-546, the model underestimated grain yield as grain yield values were below the 1:1 line. The goodness of fit (R2) as well as regression coefficients between observed and simulated data was also significant.

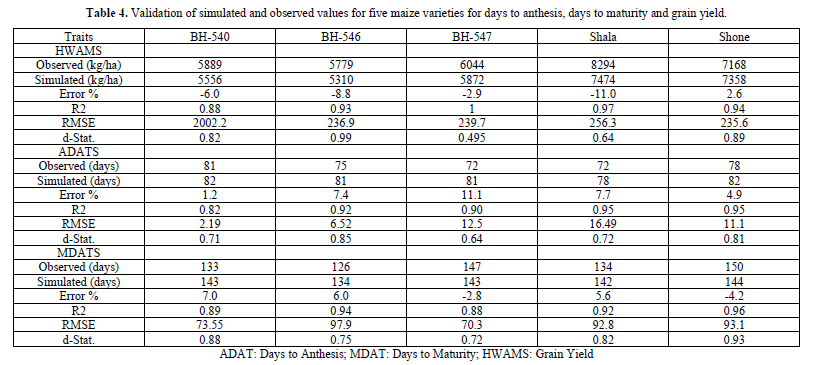

The results of d-statistic also depicted better agreement of the model for BH-540, BH-546 and Shone but less agreement with BH-547 and Shala. The coefficient of prediction was 0.77, 0.72, 0.95, 0.95 and 0.76% for BH-540, BH-546, BH-547, Shala and Shone varieties of maize in case of trend run between the observed and simulated values. The underestimation of grain yield and harvest index, and overestimation of kernel mass, grain N and total N uptake by DSSAT model was also reported by other scholars who attributed it to a very warm period during grain filling [35]. The DSSAT model seems to indicate a better grain filling rate when the temperature difference between maximal and minimal is minimized [36]. In fact, underestimation of predicted grain yield by 0·095 is considered a good assessment because a deviation of up to 0.20 of simulated yield from measured yield is considered good [37].
Comparison of calibration and validation results
The yield difference between calibrated and validated grain yield at maturity is 1.8, 1.3, 14, 8.9 and 4% due to BH-540, BH-546, BH-547, Shala and Shone, respectively. The closeness of simulated and measured grain yields in both calibration and evaluation experiments can be as a result of accurate estimation of maximum grains number per plant and kernel growth rate under optimum conditions as suggested by Adnan [38]. Dates of maturity ranged between 3 and 10 days in the calibration and between 0- and 10-days during validation testing. The prediction of anthesis showed a range of 4-11 days in calibration and 1 to 9 in validation. Thus, each variable during validations matched up very well with its counterpart in the calibrations. Some authors suggested acceptance of DSSAT model under conditions of multiple environments if difference between calibrated and validated yield from DSSAT model is less than 10% [39], which agrees with the current findings. Abedinpour and Sarangi [40] also reported underestimation of simulated yield compared to observed yield with figures as low as 18% under rainfed conditions, and attributed it to complexity of biomass and grain yield leading to difficulty in representing field dynamics.
Mean squares of flowering date, maturity date and harvest yield at maturity
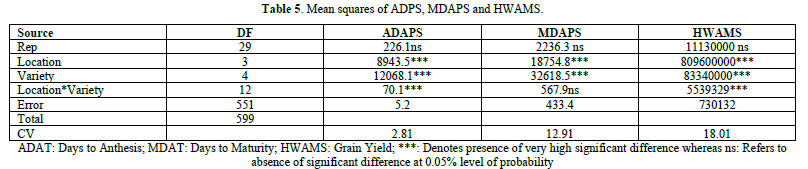
The results of ANOVA showed that the main effect of location and variety were highly significant (P<0.001) on flowering date, days to maturity and harvest yield (Table 5). The location by variety two-way interaction was also highly significant (P<0.001) on anthesis date and yield at maturity. However, variety by location two-way interaction was not significant (P<0.05) on maturity date.

Mean separation of days to flowering, days to maturity, and harvest yield at maturity
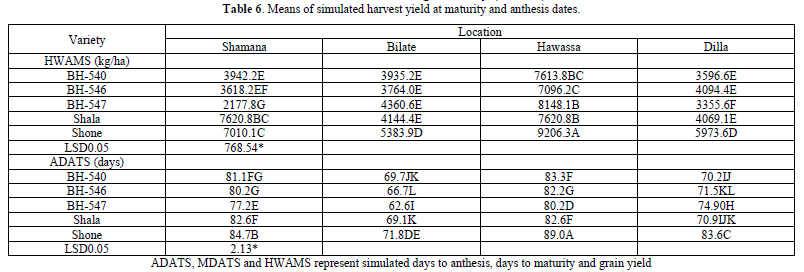
In Shamana cluster, variety Shala (7620.8 kg/ha) produced significantly (P<0.05) higher yield compared to varieties BH-540, BH-546 and BH-547 (Table 6). However, there was no statistical yield difference between yield values of variety Shala (7620.8 kg/ha) and Shone (7010.1 kg/ha). The higher grain yield could be due to the longer the growth duration period and higher growth rate compared to other varieties. In Shamana, BH-547 produced statistically lower maize yields (2177.8 kg/ha). In Bilate cluster, variety Shone produced significantly higher yield (5383.9 kg/ha) compared to other varieties. In Hawassa cluster, variety Shone was statistically superior (9206.3 kg/ha) compared to other varieties. The lowest yield in Shamana cluster was measured due to BH-546 (7096.2 kg/ha). In Dilla cluster, variety Shone produced 5973.6 kg/ha, which is significantly higher than other varieties tested in this experiment. The lowest yield in Dilla cluster was measured due to BH-540 (3596.6 kg/ha). Across all clusters, shone variety showed significantly (P<0.05) longer anthesis date compared to other varieties. Contrarily, variety BH-547 showed significantly (P<0.05) lower anthesis dates across clusters.

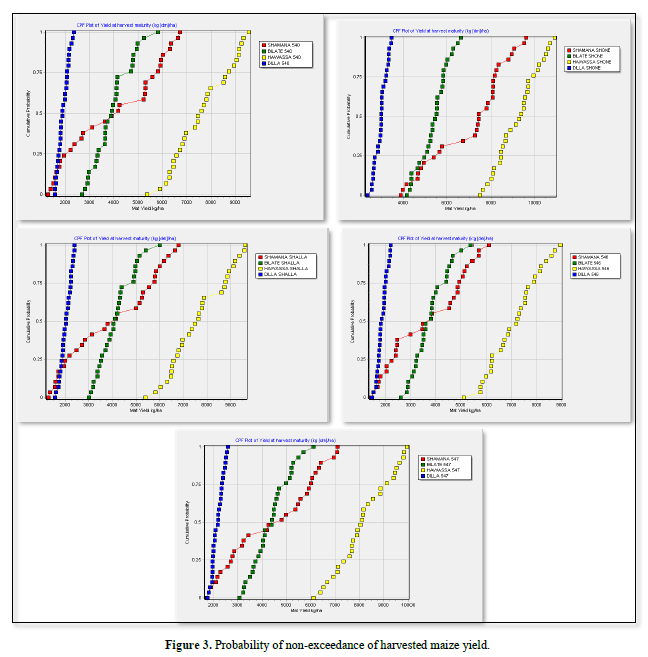
Cumulative frequency distribution (CFD) of grain yield across clusters
As the most efficient way to understand the data and the derivatives, CFD is plotted on the vertical axis and the range of data goes across the bottom (Figure 3). Results indicated that higher mean harvested yield of BH-540, BH-546, BH-547, Shala and Shone was measured in Hawassa compared to other clusters. This could be due to favorable climate for maize crop compared to other clusters. Conversely, lower mean harvested yield was measured in Dilla regardless of the varieties tested. The 75% cumulative probability of maximum average maize grain yield is 6000, 5000, 6000, 6000 and 8000 kg/ha in Shamana due to BH-540, BH-546, BH-547, Shala and Shone varieties, respectively. Moreover, the 75% cumulative probability of maximum average maize grain yield is 9000, 8000, 9000, 9000 and 10000 kg/ha in Hawassa due to BH-540, BH-546, BH-547, Shala and Shone, respectively. In Dilla cluster, the probability of non-exceedance of grain yield is linear and the model simulation hardly results over 3000 kg/ha regardless of varieties used. This could be due to higher humidity and lower sunshine arising from the traditional agroforestry system of the area, which significantly reduces crop evapotranspiration [41].
SUMMARY AND CONCLUSION
Maize (Zea mays L.) is the second most widely cultivated crop and the first in production within Ethiopia. Hence, it is necessary to understand the performance of commonly grown maize varieties in different production environments using historic climate data. The DSSAT version 4.8 was calibrated and validated for southern central rift valley environment using field experimental data. The performance of the model was evaluated through phenology and grain yield. The simulated results were in close agreement with the observed values and these were within the statistical significance limit. Grain yield, to some extent, was under predicted by the simulation but within significant limit. Simulated and observed dates to flowering was over predicted but within acceptable limit. Results of simulation experiment considering varieties Shala, Shone, BH-540, BH-546 and BH-547 across Shamana, Bilate, Hawassa and Dilla areas, and using thirty years of historic weather data with recommended management of each location, showed higher yield for Shala variety at Shamana area (7620.8 kg/ha) whereas higher yields were recorded at Bilate (5383.9 kg/ha), Hawassa (9206.3 k/ha) and Dilla (5973.6 kg/ha) from Shone variety. It can be inferred that the DSSAT version 4.8 can be successfully employed for simulating the phenology, growth and yield of maize hybrids grown under various production environments, including evaluating climate change impact and designing adaptation strategies under present and future climatic conditions of the southern central rift valley of Ethiopia.
ACKNOWLEDGMENTS
The authors acknowledge Hawassa University College of Agriculture School of Plant and Horticultural Sciences for allowing me join the PhD program in Agronomy and the National Meteorology and Climate Change Institute (the then National Meteorology Agency) Hawassa Branch Office for provision of geo-referenced weather data and SARI (Southern Agriculture Research Institute) for provision of required funds to procure weather data.
Conflict of interest: The authors state no conflict of interest.
Data availability statement: The datasets generated during and/or analyzed during the current study are available from the corresponding author on reasonable request.
Consent for publication: Not applicable.
Funding: This work was supported by Southern Agricultural Research Institute through treasury of government of Southern Nations Nationalities and Peoples Regional state for post graduate students.


No Files Found


Internationally Accepted
Share Your Publication :