
-
Publish Your Research/Review Articles in our High Quality Journal for just USD $99*+Taxes( *T&C Apply)
Offer Ends On
Publish Your Research/Review Articles in our High Quality Journal for just USD $99*+Taxes( *T&C Apply)
Offer Ends On
Mona Gohary*
Corresponding Author: Mona Gohary, DBA, Healthcare Management Instructor, AUC-School of Business, Executive Education, Cario, Egypt.
Received: October 11, 2023 ; Revised: November 04, 2023 ; Accepted: November 07, 2023 ; Available Online: December 15, 2023
Citation:
Copyrights:
Views & Citations
Likes & Shares
Sustainable healthcare encompasses principles such as equal access, decreased unnecessary therapies, improved operational efficiency, and reduced environmental impact.
This study constructs a Sustainable Balanced Scorecard (SBSC) model by identifying key indicators across eight perspectives: Finance, Internal Business Process, Customer/Patient, Learning and Growth, Economic, Environmental, Social, and Governance. The analysis of crucial hospital performance measures from pertinent literature is conducted by a panel of experts, employing the eight SBSC perspectives. The study uses DEMATEL (Decision-Making Trial and Evaluation Laboratory) structural modeling, a widely recognized method for examining various criteria. DEMATEL views relationships reciprocally, unlike unidirectional approaches. This approach is used to discover causal links between the components under research to produce a strategy map that better explains their interactions.
The study findings suggest that private hospitals prioritize sustainability in their performance reviews. Nevertheless, quantifying and monitoring sustainability's effectiveness is significantly challenging. Sustainability measures can boost investments and gain political support by aligning with government goals.
To assess the sustainable performance of private hospitals, 49 metrics were chosen according to the perspectives of the SBSC. The study reveals that ‘‘Governance Control Activities’’, ‘‘Governance Financial Activities’’, ‘‘Non-compliance with laws and regulations’’, “Return on Investment”, “% of Revenue from repeat business”, “Net Promoter Score (NPS)”, and “Patient Complaints”, the essentiality evaluation indicators for private hospitals’ performance. The strategy map shows hospital executives how to prioritize performance metrics and focus on strategic critical indicator measures. This lets them better deploy their limited resources to the most pressing issues.
Keywords: Sustainable healthcare, Sustainable balanced scorecard, Private hospitals, Performance measurement, Decision making trial and evaluation laboratory
INTRODUCTION
Better models are required for healthcare organizations in order to enable corporate governance and performance monitoring [1]. Khan [2] and Delai and Takahashi [3] claim that combining management and control with sustainability may result in increased stakeholder accountability and engagement throughout the value chain. Challenges to social integration, environmental preservation and economic growth continue to be obstacles to sustainable healthcare service delivery, especially in underdeveloped nations. However, there is no framework or model in place in the context of healthcare for measuring social, environmental, and economic sustainability.
The notion of value has transformed to encompass non-financial metrics that assess the efficacy of healthcare systems, including service quality and patient satisfaction. These measures are presented in a balanced scorecard framework and employed as a component of management oversight [4]. According to Porter [5], enhancing value is contended to have advantageous outcomes for patients, payers, providers, and suppliers, as well as promoting the economic viability of the healthcare system.
Although there has been a rise in the financial allocation to the Egyptian health sector, the duration of waiting lists remains extensive. Additionally, as per the report by the World Health Organization (WHO), Egypt's health system exhibits indicators such as a rise in mortality rates and a decline in the number of physicians and nurses per 1,000 individuals [6]. The indicators as mentioned earlier give rise to uncertainties regarding the efficacy of the healthcare industry in Egypt. Health organizations make significant efforts to assess the efficacy of their resources and obtain dependable data regarding the caliber of their healthcare systems. In addition, a multitude of stakeholders involved in the healthcare industry, including but not limited to potential investors, patients, suppliers, creditors, governmental agencies, and financial institutions, exhibit a strong interest in distinguishing between healthcare providers that operate efficiently and those that do not, as well as identifying the primary factors contributing to inefficiency. This is done with the aim of enhancing overall performance.
The SBSC architectures strive to incorporate a holistic perspective of short- and long-term objectives across all three dimensions of organizational performance, namely social, environmental, and economic, in order to attain environmental targets while simultaneously ensuring sustainable business prosperity. However, due to the dearth of trustworthy sources of performance metrics for private hospitals, hospitals frequently struggle to discover adequate performance indicators.
A limited number of studies have investigated private hospital performance indicators despite the fact that there have been many studies on measuring performance [7]. This study aims to create a Sustainable Balanced Scorecard (SBSC) model with the integration of Economic, Environmental, Social, and Governance (EESG) indicators in order to efficiently and effectively monitor, evaluate, and control hospital performance considering that Egypt lacks a national indicator set for benchmarking and improvement of hospital performance. Second, the study intends to demonstrate linkages of cause and effect between the various SBSC dimensions and indicators using the DEMATEL (Decision-Making Trial and Evaluation Laboratory) approach.
RESEARCH OBJECTIVES
This study aims to discern the pivotal metrics within the four dimensions of the conventional Balanced Scorecard (BSC), namely financial, internal process, customer, and learning and growth, as well as the sustainability perspectives encompassing environmental, economic, social, and governance perspectives. The study also aims to formulate a Sustainable Balanced Scorecard (SBSC) tailored to private hospitals in Egypt. Furthermore, utilizing the Decision-Making Trial and Evaluation Laboratory (DEMATEL) method and the SBSC framework, a causal relationship between the diverse dimensions and performance indicators is constructed.
IMPORTANCE OF THE STUDY
Healthcare leaders have acknowledged the significance of the balanced scorecard framework in establishing a connection between clinical and organizational practices, outcomes, quality, value, and cost. However, despite its adoption, the emphasis of balanced scorecard users has primarily been on enhancing quality and processes while simultaneously maintaining the financial performance of the organization. As a result, the causal relationship between performance indicators within the scorecard and their linkage to the organization's strategic objectives has been overlooked [8]. Furthermore, the absence of a well-defined structure for promoting social integration, as well as safeguarding economic and environmental interests, has a significant impact on providing sustainable healthcare services.
The objective of this study is to address the deficiency above by identifying a distinct group of attainable and pertinent performance metrics for private healthcare facilities in Egypt. Additionally, this study aims to analyze the causal connection among the various perspectives of the Strategic Balanced Scorecard (SBSC).
RESEARCH SETTING
The study's target population consisted of for-profit private hospitals in Egypt's tertiary sector, with a bed capacity ranging from 100 to 499. The Unit of Analysis was specified as a singular private hospital. As per the most recent statistical yearbook (2021) published by the Egyptian Ministry of Health (MOH), the aggregate count of private hospitals in the country amounts to 1325. It is noteworthy that out of this total, only 23 private hospitals have been deemed eligible for inclusion in this study based on the established criteria. The study necessitates the involvement of 22 hospitals, with a confidence level of 95 and an error margin of 5%.
The study's focus is on a specific group of participants who hold executive positions in hospitals, such as the Chief Executive Officer (CEO), Chief Operating Officer (COO), Chief Medical Officer (CMO), and Chief Quality Officer (CQO). These individuals possess a healthcare background and have accumulated over 15 years of experience in the field. The inclusion of a diverse pool of interviewees facilitated the attainment of a representative sample of data and mitigated the risk of selection bias [9].
Initially, the participants are provided with an orientation regarding sustainability and its corresponding indicators. After gathering the initial set of performance indicators from relevant literature, the participants are instructed to rate each indicator's importance for monitoring, evaluating, and controlling the hospital's performance using an 11-point Likert Scale. The scale ranges from 0 (indicating no importance) to 10 (indicating extreme importance). The indicators are classified into eight distinct perspectives, namely Financial, Internal Business Process, Customer/Patient, Learning and Growth, Economic, Environmental, Social, and Governance. Indicators that receive scores of 9 (indicating very important) and 10 (indicating extremely important) are regarded as the most crucial indicators for evaluating a hospital's performance. The final set of critical performance indicators is verified for its validity by the participants. The DEMATEL methodology is utilized to evaluate the causal connections among various indicators through the use of matrices and relevant mathematical theories.
LITERATURE REVIEW
Healthcare Performance Management
The accomplishment of specific objectives, whether they be managerial or medical, defines hospital performance. The term performance encompasses not only the aspect of quality but also other variables, such as the cost and accessibility of care, as well as the correlation between patient satisfaction and their expectations. The concept of high performance in healthcare denotes the delivery of efficient, top-notch, and easily accessible medical care that leads to positive patient experiences [10].
The assessment of hospital performance, as defined by the World Health Organization Regional Office for Europe, encompasses six distinct dimensions. These dimensions include clinical effectiveness, efficiency, staff orientation, responsive governance, safety, and patient-centeredness [11]. In recent decades, the subject of performance management within healthcare organizations has emerged as a prominent area of research that has garnered significant interest from scholars. Behrouzi and Ma'aram [7] proposed a flexible approach to aid private hospitals in identifying and prioritizing viable and pertinent performance indicators across the balanced scorecard perspectives. In a study conducted by Cinaroglu and Baser [12], they aimed to investigate the correlation between healthcare performance and health outcome indicators through the application of a pathway analytic model. Gu and Itoh [13] administered two questionnaires to obtain performance metrics for facility management of dialysis centers in Japan. Additionally, Gu and Itoh [14] explored the aspects influencing expert opinions on the utility of indicators and their essential attributes for creating key performance indicators (KPIs) for hospital management. In their study, Núñez [15] identified five distinct categories of key performance indicators (KPIs) through a comprehensive field investigation and consultation with experts. These KPIs were developed to facilitate the monitoring and management of emergency department performance.
The study conducted by Peixoto [16] employed principal component and cluster analysis methodologies to assess the efficacy of Federal university hospitals in Brazil. Soysa [17] designed a performance scoring mechanism to evaluate the comprehensive strategic performance of non-profit healthcare entities in Australasia. Si [18] presented a framework for identifying and assessing performance indicators in hospital management. The framework integrates the evidential reasoning method, interval 2-tuple linguistic variables, and the DEMATEL technique. Furthermore, Kahraman 20 analyzed of the performance measures pertaining to healthcare services in a research hospital, utilizing an integrated approach of fuzzy analytical network process (ANP) and DEMATEL.
Schwartz and Deber [19] conducted a study on the performance management system utilized in healthcare systems across English-speaking nations. Their findings revealed a performance measurement-management divide, wherein measurement results are underutilized for performance management improvement. Instead, the performance management system functions primarily as a surveillance tool, providing information for public consumption.
Zidarov [20] reported comparable findings wherein they conducted a thorough analysis of the execution of performance management systems in a Canadian rehabilitation hospital and identified the factors that influenced this process. The study results reveal that insufficient planning regarding the potential utilization of the performance management system, coupled with a dearth of senior management involvement and inadequate resources allocated to the implementation process, culminated in the establishment of a substandard performance management system that is mismatched with the information requirements of hospital management [20]. The consequence of this was a decline in the system's original purpose as a decision-making aid, with a shift towards its utilization as a means for monitoring and accountability [20].
Naranjo-Gil [21] analyzed Spanish public hospitals and found that the implementation of sustainable policies resulting in both short-term and long-term performance was enabled by the comprehensive design of management control systems and the heterogeneous composition of the senior leadership team. The engagement of clinical professionals in the process of performance management promotes the congruence between the application of performance metrics and strategic objectives, thereby influencing the operational efficacy of healthcare institutions as the cost-aware intensifies among clinical leaders [22] & given the imperative for ongoing improvement in the quality of care and services, as well as the importance of assessing the performance of care and service providers, it is essential to carefully select appropriate measurement tools in order to achieve this objective [23]. The Business Excellence Model (BEM) developed by the European Foundation for Quality Management (EFQM) is the only other extensively implemented framework, in addition to the Balanced Scorecard (BSC). Andersen [2000] conducted a comparative analysis between the Balanced Scorecard (BSC) and the Business Excellence Model (BEM). Their findings indicated that although the BEM was effective as an investigative tool, the BSC was superior as a performance measurement system owing to its explicit relevance to strategic management for organizations that employ it.
In Egypt, one of the strategic objectives outlined in Egypt’s 2030 Vision is the establishment of a regulatory system that is characterized by clear oversight, transparency, and equitable practices. The establishment of an independent authority has made it necessary for health facilities to meet accreditation requirements in order to contract with them to provide services to citizens. This measure has been put in place to guarantee the quality and safety of health services. The foundation of the General Authority for Healthcare Accreditation and Regulation (GAHAR) was mandated by Law No. 2 of 2018, which pertains to the Universal Health Insurance system.
The maintenance of its accrediting and regulating status, as mandated by law, is a crucial responsibility of GAHAR, which must be upheld with a strong commitment to independence. GAHAR is an autonomous regulatory body that operates under the direct oversight of the president. GAHAR is tasked with establishing and implementing standards that promote the delivery of healthcare services across various healthcare facilities, with a focus on upholding the highest levels of quality and safety. The standards above have been formulated by professionals in the healthcare quality field and are designed to align with current advancements in the quality and worldwide safety.
The established standards serve as foundational elements that ensure the provision of secure healthcare services to patients. The focus of GAHAR's work is centered around the patient as the primary axis. The function of GAHAR is not restricted solely to the assessment of healthcare facilities by professionals possessing internationally recognized expertise in the healthcare domain. Rather, it encompasses aiding healthcare establishments in enhancing their performance and mitigating risk factors. Optimal utilization of resources and adherence to the scientific method in measurement and follow-up are essential for ensuring the provision of services with the highest levels of quality and safety (gahar.gov.eg).
BALANCED SCORECARD (BSC)
The Balanced Scorecard (BSC) methodology was formulated based on the recognition that evaluating a firm's performance extends beyond its financial aspects [24]. The Balanced Scorecard (BSC) has been a widely discussed approach for nearly three decades, with the goal of converting strategic goals into a series of quantifiable and concrete performance metrics. The term "balanced" pertains to achieving equilibrium between financial and non-financial considerations, as well as internal and external procedures and short- and long-term performance objectives [25]. The implementation of the BSC has proven to be successful in various sectors, including hospitals and healthcare services [26]. This is the sole technique that establishes unambiguous and straightforward connections among diverse performance aspects when assessing intricate systems, such as healthcare services [27].
Objective and Measures of Each Perspective
In their analysis of 22 healthcare sector case studies, Gurd and Gao [28] discovered that a majority of the scorecards examined deviated from the conventional Balanced Scorecard (BSC) framework, which comprises four perspectives. Instead, these institutions adapted the four perspectives to suit their unique circumstances and perspectives. As an illustration, a certain institution adopted a set of perspectives that encompassed client, cost, learning and growth, as well as internal process perspectives. In contrast, another institution opted for a different set of perspectives, namely financial, innovation and growth, care and service, systems integration, and research.
A questionnaire was utilized to identify viable and relevant performance measures in a survey of 35 private hospitals in Malaysia. This investigation involved the participation of hospital directors and senior managers who responded to a series of inquiries. The metrics were established based on the four dimensions of the Balanced Scorecard framework [7]. A set of ten financial performance metrics were established comprising of nine metrics from the perspective of clients/patients, seven metrics from internal processes, and five metrics from innovation and learning. The study findings indicate that metrics pertaining to the “customer” aspect, such as patient satisfaction, number of patient complaints, rates of medical errors, and number of complaints, exhibited superior scores in comparison to metrics from the financial perspective. This finding illustrates that non-monetary metrics can significantly impact the financial outcomes and overall efficacy of healthcare organizations [7]
The findings of Delen [29] corroborate those of Behrouzi and Ma’aram [7] in their assessment of the adoption of the BSC within the cosmetology industry in Ukraine. These authors conducted a survey of 13 primary clinics in a particular specialty. Their findings indicate that the indicators pertaining to the Balanced Scorecard's client perspective exhibited greater significance. Specifically, the criteria associated with service diversification, service feedback, and client/patient loyalty were deemed more influential in assessing the performance of this type of service [29]. The authors have noted that diversifying services is crucial in this sector to meet client expectations and adapt to changes in the consumer market profile for health services.
Balanced Scorecard (BSC) Generations
There exist several definitions pertaining to the various stages of the evolutionary development of the Balanced Scorecard (BSC) that have been documented in the academic literature [30]. Consensus among authors exists regarding the initial iteration of the Balanced Scorecard (BSC), which integrates both financial and non-financial metrics across the four perspectives: financial, customer, internal business processes, and learning and growth. According to Speckbacher [31] and Lawrie and Cobbold [30], the second iteration of the Balanced Scorecard (BSC) placed greater emphasis on the causal interrelationships among performance indicators and strategic objectives. On the contrary, a perspective exists within the academic literature that posits the primary value of second-generation Balanced Scorecard lies in its establishment of a structured connection among strategic management and performance management [32]. As per the findings of Lawrie and Cobbold's [30] study, the third iteration of the Balanced Scorecard (BSC) pertains to the creation of strategic control mechanisms that involve the integration of destination statements and, if deemed appropriate, two strategic linkage models from different perspectives. The authors employed the "activity" and "outcome" perspectives as alternatives to the conventional four perspectives [30]. According to Speckbacher [31], the third generation of the Balanced Scorecard (BSC) was essentially the second generation with the incorporation of action plans, targets, and incentives.
Implementation of the Balanced Scorecard (BSC)
The BSC methodology has been implemented by healthcare organizations across various nations globally. The utilization of this methodology, either independently or in conjunction with other methodologies, has exhibited effectiveness in discerning areas of proficiency and deficiency, as well as in the formulation of performance management strategies. The identification of distinct indicators derived from the four perspectives of the Balanced Scorecard enhances the likelihood of achieving favorable business outcomes [33].
Several hospitals and healthcare units have adopted the balanced scorecard approach, including Duke's Children's Hospital [34], Duke's Women's Services Clinical Business Unit [35], Mayo Clinic [36], St. Elsewhere Hospital [37], and Yale New Haven System Hospital [8]. Over the course of two to three years, Duke Children's Hospital was able to decrease expenses by $30 million and augment net margin by $50 million, all while enhancing both patient and staff satisfaction. Delta Dental of Kansas, the primary dental benefits provider in the state, experienced a significant increase in revenue from $63 million in 2001 to $172 million in 2006, representing a 173 % growth rate. The company, which employs 90 individuals, also reported an improvement in employee satisfaction and job comprehension.
A study conducted in Vietnam investigated six key factors that contribute to the successful execution of the balanced scorecard methodology. These factors include the four perspectives of the balanced scorecard, as well as the hospital's mission and strategy. Among these factors, three were found to have a significant impact on enhancing hospital performance, namely the hospital's mission, internal business processes, and financial considerations [38]. In contrary to the aforementioned study conducted in Thailand, which utilized a balanced scorecard approach to assess performance trends across 52 hospitals over a five-year period, the results of the current analysis indicate that there were no discernible differences in hospital performance across the various perspectives of the balanced scorecard during the same time frame. These results suggest that the balanced scorecard can serve as a valuable tool for evaluating hospital performance and identifying areas for improvement in strategic planning [39].
The research conducted in Indonesia investigates the utilization of the balanced scorecard across diverse manufacturing sectors, including hospitals. The findings indicate that there are commonalities in the implementation of the balanced scorecard across industries such as BUMN, Health, Cooperative, Medical, and Transportation. As a result, the study suggests that enhancing the application of the balanced scorecard methodology can be beneficial across all business sectors [40]. Liu [23] conducted a study aimed at examining the impact of the implementation of a balanced scorecard approach on the improvement of performance and care quality in privately-owned clinics in Taiwan. The researcher's case-control study demonstrated that the clinics utilizing balanced scorecards exhibited a greater enhancement in the proficiency of their physicians and nurses compared to the control clinic [23].
A study in Malaysia targeted evaluating the organizational framework and efficacy of hospitals through the implementation of the Balanced Scorecard approach, with a particular emphasis on the viewpoints of individuals in positions of authority. The results indicate that a significant proportion of private hospitals in Malaysia that implement the Balanced Scorecard approach exhibit a high degree of centralization and formalization. This implies that these hospitals follow established written protocols and guidelines to ensure that healthcare providers conform to the stated principles of management and governance. Consequently, a valid correlation exists between enhanced performance within this industry and critical factors such as internal business procedures, patient service quality, safety and contentment, organizational learning and growth, and financial outcomes [41].
Another study conducted by Meena and Thakkar [42] aimed to create a comprehensive system for evaluating the performance of the healthcare industry by utilizing the balanced scorecard methodology. The researchers identified the primary indicators through the use of scorecards and analyzed their interrelationships using a combined approach of Interpretive Structural Modeling (ISM) and Analytic Network Process (ANP).
The performance evaluation of Hasheminejad Hospital in Tehran was conducted by Tabrizipour [43] utilizing a balanced scorecard. The study's findings indicate that the hospital demonstrated success in both financial and customer-oriented aspects, however, it fell short in terms of accomplishing its growth and learning objectives. The satisfaction of both patients and their families was identified as the primary measure of hospital performance in the research. Raeisi [44] employed a scorecard methodology to assess the performance indicators of al-Zahra hospital located in Isfahan. According to Raeisi [44] research, the internal processes and growth and learning indicators exhibited the highest figures.
A review was conducted by Heather Smith and Kim Il Woon from Summa Hospital, Ohio in 2005, which examined the benefits and drawbacks associated with the introduction of the Balanced Scorecard (BSC) in healthcare facilities within the region. The findings indicate a mean monthly sales growth of 2% in the financial domain. Moreover, the non-monetary outcomes indicated a rise in the quality audit outcomes of food services. The audit's four components surpassed the 94% target. The customer satisfaction index achieved an overall score of 75.7%, surpassing the predetermined target of 73.7%. The implementation of the Balanced Scorecard (BSC) was found to have a favorable effect on the performance of the hospital [45].
Balanced Scorecard (BSC) in the Private Health Sector
The domain of private healthcare is characterized by a highly competitive market. The primary goals of this industry are to enhance financial gains and customer contentment by optimizing expenses. In this particular scenario, the satisfaction of the customer pertains to a highly valuable asset, namely, their health. In addition, the expansion of health services supply necessitates the ongoing assessment and adjustment of performance metrics to accommodate evolving demands. As a result, the Balanced Scorecard is deemed one of the most appropriate instruments for performance administration within the private healthcare industry [7].
Cause and Effect Relationship between Balanced Scorecard (BSC) Perspectives
The original work of Kaplan and Norton suggests that there exists a presumed linear cause-and-effect interrelationship in a particular sequence among the four perspectives of their Balanced Scorecard (BSC). Additionally, there is a comparable cause-and-effect correlation between lead and lag measures within each perspective [46]. Nonetheless, certain scholars have contended that it is imperative to subject relationships to rigorous scrutiny rather than presuming causality, given that the underlying factors may be inadequately comprehended during the execution of the Balanced Scorecard (BSC) and may hinge on the distinctiveness of the particular organizational milieu [47]. It can be inferred that causal relationships may not possess a universal nature across all healthcare organizations, regardless of the temporal or situational context. Although Kaplan and Norton do not recommend it, there is an implication that metrics should be built on a presumed cause-and-effect relationship. However, this assumption is not only problematic, but also overly simplistic, as it cannot be assumed that all metrics can be logically connected in a specific way [48].
In their study, Yang and Tung [49] employed path analysis to examine whether a set of key performance indicators (KPIs) chosen for a balanced scorecard (BSC) exhibited a causal relationship both between and within the various perspectives of the BSC. The objective of the study was to comprehend the key performance indicators (KPIs) utilized by hospitals in Taiwan from a longitudinal perspective. The findings corroborate the notion that the Balanced Scorecard (BSC) manifests a causal association between the various viewpoints and within the perspectives of the Key Performance Indicators (KPIs) that were chosen. Empirical studies have established a correlation between hospital performance and the concept of causality.
Lin [2014] posited that augmenting the Balanced Scorecard (BSC) design with additional measures can improve organizational performance by establishing causal relationships between leading and lagging factors. In their study, De Geuser [2009] examined causal relationships and determined that the implementation of the Balanced Scorecard (BSC) led to improved performance. According to Chang [2008], the introduction of the Balanced Scorecard (BSC) in a sizable medical facility in Taiwan resulted in an overall enhancement of organizational performance.
Sustainability
In 2015, the United Nations General Assembly proclaimed a call for worldwide action and implemented the 2030 Agenda for Sustainable Development [50]. The aforementioned statement encompasses a set of 17 sustainable development objectives and 169 associated targets, aimed at accomplishing sustainable development across the economic, social, and environmental domains by the year 2030. The concept of sustainable development has experienced significant growth across various scales, including local, national, regional, and international, subsequent to the United Nations conference held in 1972.
In recent times, sustainability has garnered augmented interest from scholars, as is apparent from the ongoing investigations into certain sub-fields. Bergman [51] conducted research on the opaque nature of corporate governance, specifically examining the interplay between corporate sustainability and other strategic themes. Galpin [52] analyzed the correlation between organizational culture and sustainability. Szekely and Strebel [53] and Trifilova [54] concentrated on the subject of sustainability-driven innovation. Faber [55] explored the concept of the “sustainability of sustainability”. Lastly, Glavic and Lukman [56] delved into various definitions and concepts related to sustainability.
The pursuit of corporate sustainability necessitates the development of sustainability-focused strategies, business models, investments, and management tools that generate enduring environmental, social, and economic value. The awareness of sustainability typically plays a crucial role in the implementation of tools for managing sustainability [57].
While sustainable development standards have been a recent area of focus for organizations specializing in standardization, their main attention has been directed towards the construction sector. The European Committee for Standardization (CEN) system encompasses a set of standards pertaining to sustainability. The CEN has presented a distinctive method for evaluating sustainability performance by establishing a standard that is specifically tailored to each dimension of sustainability, namely the economy, social, and environmental aspects.
Despite the existence of some noteworthy examples, such as Eriksson and Svensson [58] and Tate and Bals [59], sustainability study still suffers from a dearth of theoretical underpinnings. The research endeavor encompasses endeavors to identify and classify diverse facets for incorporation into the realm of sustainability. According to Hueskes [60], the social aspects of sustainability have been mostly disregarded. The apparent cause of this disregard can be attributed to the challenges involved in devising quantifiable criteria for social sustainability.
According to Nikolaou [61], an additional significant governance approach involves incorporating sustainability factors into the award criteria and assessing them with a significant emphasis. The implementation of a minimum score requirement for each criterion of sustainability awards could potentially mitigate the occurrence of strategic bidding conduct.
The healthcare sector currently faces a dearth of a comprehensive framework that can facilitate the dissemination of information for environmental decision-making and enable a quantitative evaluation of the efficacy of sustainability endeavors pertaining to medical goods and services [62]. Moreover, there is a deficiency of agreement among scholars about the appropriate structure or classification system for such a framework.
The Alberta Genuine Progress Indicator (GPI) project, undertaken by the Pembina Institute situated in Alberta, has resulted in the development of a 51-indicator framework. Alberta employs a range of initiatives to gauge the overall societal well-being, thereby positioning itself as the leading province in Canada in terms of establishing publicly reported indicators for monitoring progress. The GPI is comprised of a total of 51 indicators, encompassing various dimensions such as social, economic, and environmental factors. Sustainable Calgary has devised a framework consisting of 36 indicators to assess the state of well-being within its jurisdiction. The results of this evaluation have been recorded in the 'State of Our City' report [63].
Economic Sustainability in Healthcare
The swift tempo of economic transformations in recent decades has necessitated the comprehension of the impacts of such changes on an organization's operations and their potential to enhance performance [64].
From an economic perspective, the main objective of the healthcare sector is to deliver outcomes that benefit the society [17]. In the wake of the public sector reforms that took place in the 1990s, many countries, including those in the developing world, have expanded the managerial supervision of their healthcare systems. The introduction of novel components encompasses the provision of efficiency metrics via budgetary oversight, effective monitoring mechanisms for activity-based funds and throughput mix volumes, coupled with the establishment of a broader system of accountability [65]. The utilization of balanced scorecards is deemed significant in the public sector as it enhances management accountability and control on a wider scale [4].
Contemporary performance evaluations encompass a range of dimensions, including financial performance within predetermined budgets, indicators of care quality such as readmission rates and infection rates, as well as wait times for emergency and elective patient admissions [66]. There is a growing trend where healthcare service providers and those who adopt a patient-centered approach are motivated to fulfill these performance measures [67].
The expenses linked to wellness and health promotion, also known as preventive health, constitute a significant and expanding component of the contemporary value-based healthcare program [68]. Porter and Teisberg's [69] approach to healthcare, which is based on values, is primarily oriented towards economic and individual considerations, rather than encompassing the environmental and wider social dimensions outlined by the United Nations Sustainable Development Goals (SDGs), from a sustainability standpoint. This approach indirectly acknowledges social accountability by defining value in relation to meeting the needs of patients rather than service providers. However, it does not explicitly address the issue of healthcare access for key stakeholders, including vulnerable and marginalized populations [70].
According to Kim [71], a comprehensive evaluation of value demonstrates the fallacy of perceiving healthcare investments as a hindrance to the productive capacity of an economy. Therefore, additional research is required to assess the system's value from a more comprehensive stakeholder viewpoint [70].
Sustainable Governance in Healthcare
The concept of sustainable governance refers to a form of governance that incorporates the fundamental principles of sustainable development [72]. Frequently updated and monitored development management plans have the potential to make a valuable contribution to the process of policy-making [73]. The aforementioned studies propose that the fundamental elements of corporate governance ought to be evaluated in the context of healthcare coverage practices. The European Union has taken measures to tackle health system challenges by promoting the implementation of structural hospital reform through the provision of policy guidance and financial incentives [74]. It is imperative to consider variables such as quality methodologies, clinical governance, and performance [75].
Social Sustainability in Healthcare
The present discourse considers sustainability within the framework of comprehensive strategies for healthcare and preventive medicine. The concept of integrated care is centered on establishing linkages between primary and tertiary healthcare and social services, with the objective of providing optimal outcomes for patients who suffer from chronic ailments and intricate requirements [76]. The objective of maintaining these patients outside of medical facilities is encompassed by the concept of social sustainability, which involves fulfilling welfare necessities such as fundamental health and educational prerequisites, preserving resources, fostering a cohesive living atmosphere through social engagement, facilitating daily life processes, and offering accessible areas to enhance social welfare [77].
The attainment of social sustainability is characterized by a robust sense of social unity that amplifies the quality of life of individuals [78]. This perspective being conveyed is encapsulated within the United Nations' Sustainable Development Goal 3, which is titled 'Good Health and Wellbeing'. This goal adopts a comprehensive approach towards the health and wellness of the general population, with the aim to guarantee optimal health and enhance overall wellness for individuals across all age groups.
The third United Nations Sustainable Development Goal acknowledges the significance of providing assistance to developing nations in contrast to developed nations, owing to the presence of numerous external governments and healthcare service providers who oversee diverse community health philosophies, associated health expectations, and value systems [79].
Nevertheless, the persistence of inequitable treatment and biases based on race, gender, and socio-economic status undermines the trust of the public [80]. Significant disparities and inequities persist in healthcare accessibility within low- and middle-income nations. Patients residing in isolated areas and those with inferior socioeconomic status encounter particularly arduous challenges in accessing public healthcare services [81,82].
Although there have been significant advancements in healthcare delivery mechanisms, there still exist disparities among different social groups. Empirical data suggests that individuals belonging to economically disadvantaged backgrounds, women, rural and tribal communities, scheduled castes (SC), and certain minority groups exhibit a lower health status [81,83]. Despite the intended universality of healthcare facilities, certain cultural groups are frequently denied access.
Environmental Sustainability in Healthcare
The healthcare industry exhibits a higher level of energy intensity compared to other commercial and service sectors and appears to be less involved in endeavors aimed at mitigating emissions [84]. As a result, there has been a growing demand for prompt measures and improved administration of carbon emissions, energy usage, and waste disposal protocols within the healthcare sector [77]. Improved assessment and documentation of ecological issues pertaining to healthcare, along with their corresponding disease burden, can enhance healthcare responsibility and offer comparative perspectives both inter- and intra-nationally [85].
Thakur [86] emphasized the necessity for global governments and health authorities to implement policy and legal structures pertaining to healthcare waste management in order to alleviate significant adverse economic, social, and environmental outcomes.
Sustainable Development Indicators (SDIs)
The significance of developing SDIs was publicly acknowledged by delegates at the 1992 Earth Summit, which was also referred to as the United Nations Conference on Environment and Development (UNCED), Rio de Janeiro Earth Summit, Rio Summit, and Rio Conference. Sustainable Development Indicators (SDIs) aid nations in making well-informed choices concerning sustainable development. Charter 40 of Agenda 21 emphasizes the importance of establishing a strong basis for decision-making and calls upon national governments, as well as international governmental and non-governmental organizations, to recognize and cultivate sustainable development indicators (SDIs). The Work Program on Indicators of Sustainable Development was approved by the Commission on Sustainable Development (CSD) in 1995. SDIs were subjected to initial testing from 1994 to 2001.
The Sustainable Development Goals (SDGs) mandate the implementation of measures aimed at eradicating poverty, safeguarding the environment, and promoting global peace and prosperity for all individuals. The 17 Global Goals encompass a range of objectives aimed at addressing various global challenges. The list of objectives includes the eradication of poverty, provision of affordable and clean energy, implementation of measures to address climate change, elimination of hunger, promotion of decent work and economic growth, preservation of life below water, promotion of good health and well-being, advancement of industry, innovation, and infrastructure, preservation of life on land, provision of quality education, reduction of inequalities, promotion of peace, justice, and strong institutions, promotion of gender equality, development of sustainable cities and communities, establishment of partnerships for the goals, provision of clean water and sanitation, and promotion of responsible consumption and production [50].
Regional organizations prioritize the development of frameworks tailored to address local social, economic, and environmental requirements, as opposed to utilizing a universal set of indicators. According to Eurostat, which is a directorate-general of the European Commission, and the European Environmental Agency (EEA), SDIs should be developed at a suitable level of detail to enable a comprehensive evaluation of the situation concerning each specific challenge within the EU system.
Eurostat has developed SDIs that utilize a hierarchical theme framework and are categorized into ten distinct themes. The aforementioned categories are subdivided into distinct sub-themes that correspond to the practical goals and initiatives outlined in the sustainable development strategy (SDS). The indicators have been structured in the form of a hierarchical pyramid consisting of three levels, namely, overarching goals, operational or priority objectives, and actions. Eurostat has identified ten themes, namely socio-economic development, sustainable consumption and production, social inclusion, demographic changes, public health, climate change and energy, sustainable transport, natural resources, global partnership, and good governance. The indicators that are encompassed within each theme have been categorized into three distinct levels, which are representative of the SDS.
The United Kingdom Sustainable Development Strategy has devised a collection of indicators that are categorized into 21 groups of sustainable development concerns. The main aim of this initiative is to provide pertinent information to the government, non-governmental organizations, industry, and the general public regarding sustainable development issues (ECIFM, Undated).
Numerous academic researchers have examined the significance of sustainable development indicators. Alkan-Olsson [87] have emphasized the necessity of devising sustainable development indicators (SDIs) that effectively capture the complex interrelationships and interdependencies among the economy, society, and environment, rather than relying on a single indicator for each concern. Additionally, the authors suggest the incorporation of a range of viewpoints regarding global affairs, the promotion of sustainable growth, temporal and spatial factors, and the involvement of all parties involved in the endeavor. The attainment of said objectives necessitates adherence to a corpus of literature on Spatial Data Infrastructures (SDIs), which proffers a variety of directives, variables, and/or characteristics that the indicators must meet.
RESEARCH METHODOLOGY
Methodology and Participants Involved in the Study
The target population for this study is for-profit private hospitals in Egypt. The eligibility criteria pertain to for-profit private hospitals operating at a tertiary level (indicating their specialization in various medical fields) with bed capacity ranging from 100 to 499. The rationale for these criteria is that hospitals exhibiting these characteristics are more likely to prioritize the implementation of a comprehensive performance management system in order to effectively govern their complex internal business processes. The Unit of Analysis was specified as a singular private hospital.
As per the most recent data from the Ministry of Health (MOH) in Egypt, there exists a total of 1325 private hospitals, out of which 23 have been deemed eligible for inclusion in the present study (MOH Statistical Year Book 2021). The study necessitates the involvement of 22 hospitals to achieve a confidence level of 95 and an error margin of 5%.
The initial stage involves conducting a literature screening process to identify pertinent indicators for the traditional balanced scorecard perspectives, namely Financial, Customer/Patient, Internal Business Process, and Learning and Growth, in addition to the sustainability perspective encompassing Economic, Environmental, Social, and Governance perspectives.
The second step involves the distribution of questionnaires comprises the initial compiled performance set, which aims to assess the significance of each indicator for monitoring, evaluating, and controlling hospital performance. This is achieved through the utilization of an 11-point Likert scale, which ranges from 0 (indicating not at all important) to 10 (indicating extremely important). The selection of the 11-point Likert scale is based on its superior test-retest reliability, as well as its high Cronbach alpha coefficient and validity, which are further supported by the strong preferences of the respondents [88].
Content validation was performed to enhance the content validity of the indicators derived from literature. The process of content validation entails the evaluative judgment of individuals who possess expertise or professional qualifications in the relevant area of inquiry. The aim is to ascertain the degree to which the measurement instruments created to assess a particular attribute of concern are optimal [89]. The process of content validation involves ensuring that an assessment tool accurately measures the intended construct and that the items included in the tool appropriately represent the content domain. According to Nunnally's [90] recommendation, a minimum of 5-10 experts is necessary to effectively evaluate content domains using rating scales.
This study involved the acquisition of expert feedback through the distribution of questionnaires, which were administered individually via interviews. The expert evaluations were subsequently assessed for their validity, based on the professionals' respective levels of experience and knowledge [1]. Surveys are a cost-effective and efficient means of gathering factual data from a research population [91].
The study utilized purposive sampling to select participants who possess expertise and can offer high-quality and valuable insights [92]. In pursuit of this objective, a cohort of 22 healthcare executives comprising of one Regional Director, eleven Chief Executive Officers, five Chief Operating Officers, four Chief Medical Officers, and one Chief Quality Officer were enlisted as participants in this research. All individuals involved possess a healthcare management background and have acquired a minimum of 15 years of experience in the field of hospital management.
The third step involves compiling indicators that have received scores of 9 and 10, which correspond to “Very important” and “Extremely important”, respectively. These indicators will be validated as the most critical ones. Ultimately, the Decision-Making Trial and Evaluation Laboratory (DEMATEL) method is employed to depict the causal relationship between the diverse dimensions and performance indicators.
Data Extraction
The present study conducted a comprehensive literature review to identify pertinent research by utilizing various electronic databases, such as Google Scholar, Emerald, Taylor and Francis, ScienceDirect, Springer Nature, Wiley, and ProQuest databases. The search terms utilized were a conglomeration of "hospital," "performance," "assessment," "evaluation," "measurement," "indicator," "sustainability," "balanced scorecard," "ESG," economic indicators, environmental indicators, governance indicators, social indicators, and private hospitals. The utilization of Boolean operators, specifically the OR and AND operators, was employed to connect keywords in the process of conducting searches. Initially, the titles of all articles were scrutinized, followed by a subsequent review of the abstracts of the chosen articles. Subsequently, a comprehensive analysis was conducted on the complete texts of the chosen articles. Specifically, articles pertaining to the measurement and evaluation of hospital performance, as well as indicators in this domain, were meticulously identified based on their relevance to the study's intended purpose.
Data Synthesis
The initial assemblage of data underwent a review process to eliminate any instances of duplicated indicators. The proposed SBSC was able to identify a total of 115 indicators, which were then classified into eight distinct perspectives. These perspectives include Financial, Internal Business Process, Customer/Patient, Learning and Growth, Economic, Environmental, Social, and Governance. The breakdown of indicators per perspective is as follows: 25 for Financial, 50 for Internal Business Process, 8 for Customer/Patient, 7 for Learning and Growth, 6 for Economic, 8 for Environmental, 3 for Social, and 8 for Governance perspectives.
Cause and Effect Relationship
The critical factors that were identified in the preceding step are presented to the participants for evaluation. The participants are requested to rate the degree of impact of these factors on the selected indicators, using a five-point Likert scale that ranges from 1 (signifying no impact) to 5 (signifying strong impact). The DEMATEL method is employed for establishment of causal interrelationships among various perspectives and measures within the proposed Sustainable Balanced Scorecard (SBSC) framework.
DEMATEL Structural Modelling
The DEMATEL method, which is a tool for decision-making and evaluation, was developed by the Battelle Memorial Institute's science and human affairs program in Geneva during the years 1972 to 1976 [93]. It was employed to investigate the intricate connections between the criteria and to pinpoint significant trends in the heterogeneous outcomes [94,95].
This approach has the capability to transform the associations among the causality and outcome of standards into a structural framework, thereby providing a means to manage the interrelatedness within a given set of criteria [96,97]. Furthermore, stakeholders can utilize the DEMATEL technique to establish the precedence of factors. This methodology is capable of effectively segregating a collection of intricate factors into distinct causal categories, thereby facilitating the creation of a comprehensible causal graph.
According to research, constructing a direct relation matrix using cause and effect relationships is a practical approach [98]. This approach can effectively capture the intricacy of a given problem, thereby streamlining the process of making informed decisions [99]. The present study employed the DEMATEL algorithm, as described by Tzeng [100] and Kala and Bagri [101], and executed it through the subsequent stages:
Step 1: Obtain experts' opinions and compute the average matrix [Z].
This phase involves the utilization of a group of h professionals and n components. An expert is being asked to evaluate the degree of direct impact observed on individual elements in pairs. The score assigned to an integer falls within the range of 0 to 5, with 0 indicating the absence of any impact and 5 indicating a significant impact. The variable ij denotes the level of influence that an expert attribute to element i on element j. Each expert participating in the assessment procedure generates a positive matrix of dimensions n x n. The total number of experts involved in the procedure is denoted by k, where 1 ≤ k ≤ h. Therefore, X1, X2, X3, ..., Xh represent matrices generated by h professionals. The first equation demonstrates the mean matrix used to combine evaluations from a set of h specialists. 1X

Step 2: The initial direct-relation by computing matrix (D)
The normalized initial direct-relation matrix D = (dij), whereas the weights of every factor in matrix D would be ranged between (0, 1), Equation (2) illustrates the computation.
Step 3: The total relation estimate by computing matrix (T)
The aggregate-impact matrix T is generated using equation (3), where, I is an n*n identity matrix. The characteristic of tij denotes the indirect impacts that element i has on element j, and then the matrix T represents the total relation between every pair of elements. T (tij) factors clarify the significance of that relationship (from element i to element j) compared to all potential connections between elements.
Step 4: Compute the sums of rows and columns of matrix (T)
The sum of the rows and columns in the complete-impact matrix T is described by the vectors R and C, correspondingly. Consider that R is the sum of the rows in matrix T. The value of R demonstrates the direct and indirect impacts that factor has on other factors. Let that C is the sum of the columns in matrix T. Equations 4 and 5 showed the R and C calculations. (R + C) value indicates the “degree of significance” of both dispatch and reception. The greater the factor's values (R + C), the more interconnected they are. Likewise, the (R - C) value indicates the 'severity of impact,' showing how factors are prioritized. If (R - C) is positive, then the factor is a causal factor, dispatching the impact to other factors. If (R - C) is negative, the component is an effect factor, meaning other factors impact it. The higher the values (R - C) of the components, the more effect they have on others, and the more impact they have, the higher their emphasis is supposed to be. In other expressions, the smaller the value assigned to (R - C) components, the higher impact they get from others components, and less the anticipated importance. Equations 4 and 5 showed the R and C calculations.
Step 5: Designated a threshold value (α)
Given that matrix T contains evidence about how single component affects another, it is critical to choose a threshold value to exclude any unimportant impacts. This way only impacts higher than the threshold value should be selected and plotted. In the current study, the threshold value is obtained by averaging the components of matrix T. The average of the components calculates the threshold value (α) in matrix T, as shown in Equation (6). The computation aims to exclude certain insignificant components of matrix T [49].

Whereas, N is the entire number of components in matrix T.
Step 6: Create a graph based on cause and effect relation
The graph was generated through the mapping of a dataset consisting of (R+C, R-C) values. Its purpose is to visually represent complex interrelationships and provide insight into critical factors and their impact on other related factors [102]. Elements with values exceeding α are selected for display in the cause-effect graph [49]. The graph could be derived by plotting all sets of coordinates (R+C, R-C).
DEMATEL algorithm was done by R version 4.2.2. using package (DEMATEL) in the analysis and packages (GGPLOT2) and (GGREPEL) in plotting [103-105].
RESEARCH FINDINGS AND DATA ANALYSIS
Respondents were requested to assign scores to the identified indicators based on their significance for the purpose of monitoring, evaluation, and control within the hospital setting. Scores that are designated as (Very Important) and (Extremely Important) are the only ones taken into consideration. Subsequently, the participants were instructed to review the ultimate set of crucial indicators for the purpose of validation and to identify and communicate any inaccuracies or vagueness in its substance. The Cronbach's Alpha value for the questionnaire is 0.95.
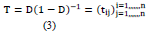
In the final set, 16% of the indicators (4 out of 25) were deemed critical from a financial standpoint. Three out of eight indicators, representing 38%, were deemed critical from a governance standpoint. In contrast, the customer/patient indicators were all identified as critical, with a 100% rating. Forty percent of the total number of internal business processes, specifically 20 out of 50, were deemed critical based on the internal assessment. Regarding the Learning and Growth perspective, a total of 5 out of 7 (71%) have been recognized as critical. From an economic standpoint, it was determined that 83% (5 out of 6) were deemed critical. Regarding the social perspective, a majority of 67% (2 out of 3) were identified as critical. Similarly, in the environmental perspective, half of the total sample, 50% (4 out of 8), were identified as critical (Figure 1).
Sustainable Balanced Scorecard Model for Private Hospitals in Egypt
The present study has synthesized the findings obtained from a sample of private hospitals’ experts, resulting in the formulation of a Sustainable Balanced Scorecard model (Figure 2). This model encompasses crucial indicators across eight dimensions, namely Financial, Customer/Patient, Internal Business Process, Learning and Growth, Economic, Environmental, Social, and Governance.
Construction of Casual Diagrams
The DEMATEL approach has demonstrated greater efficacy in comparison to alternative analytical techniques due to its predominantly theory-driven nature, as opposed to data-driven models that necessitate extensive data collection. It scrutinizes and reassesses the causal connections between factors and dimensions that have been established through expert judgments. The identification of causal relationships is imperative in order to distinguish between causes and effects, which presents a predicament for decision-makers when confronted with numerous dynamic factors that influence decision-making [106].
The present DEMATEL analysis offers a thorough examination in two tiers, encompassing both the indicators and the perspectives. The DEMATEL analysis was executed in a sequential manner, beginning with the individual indicators and subsequently moving on to the eight SBSC perspective [107,108]. Table 1 showed each perspective with its indicator and their coding.
Initial Direct Impact, Normalized Direct Impact, and Total Relations Matrices
In order to evaluate the matrix of internal relationships, it is essential to assign a threshold value. As a result, the network relationship map is designed by disregarding partial linkages. The map displays solely those connections that possess values in matrix T that surpass the threshold value, indicating their greater influence. In order to determine the threshold value for associations, it is deemed acceptable to calculate the mean values of the T matrix. Following the establishment of the threshold value, any values in matrix T that fall below this threshold are assigned a value of zero. As a result, the previously identified cause-effect relationship is disregarded. The present investigation has established that the threshold values for SBSC and individual indicators are 0.1709 and 0.0212, respectively. Consequently, any values in T matrices that fall below these threshold values have been assigned a value of zero. The entire associations' matrixes by assessing the threshold values for individual indicators are demonstrated in Appendix 6.

Causal Diagram
The values for "C+R" (causal) and "C-R" (effect) were computed using Equations (4) and (5), respectively, and are presented in Appendix 5. The "C+R" represents the impact of each perspective of the SBSC on the overall SBSC, while the effects of other dimensions are observed on their respective dimensions. The "C+R" values serves to illustrate the influence of individual indicators on both the overall model and specific indicators.
Conversely, the (C-R) values serve to characterize the magnitude of a given factor's impact on the overall model, as viewed through the lens of SBSC perspective and KPIs. In academic discourse, it is commonly accepted that a positive value of C-R indicates a causal factor, while a negative value of C-R indicates an effect.
Table 1. Coding of the Indicators.
|
F |
Financial Indicators |
|
F1 |
Return on Investment (ROI) |
|
F2 |
Net Operating Margin |
|
F3 |
Net Operating Profit After TAX (NOPAT) |
|
F4 |
Market Share |
|
G |
Governance Indicators |
|
G1 |
Annual Reports of financial Activities |
|
G2 |
Annual Reports of Control Activities |
|
G3 |
Cash value of fines and the total number of non -monetary penalties for non -compliance with laws and regulations |
|
P |
Customer/Patient Indicators |
|
P1 |
Patient Satisfaction Rate (%) |
|
P2 |
Patient Complaints/Incidence Rate (%) |
|
P3 |
Patient Retention Rate |
|
P4 |
New Customer Acquisition (%) |
|
P5 |
% of Revenue from repeat business |
|
P6 |
Net Promoter Score (NPS) |
|
IP |
Internal Business Process Indicators |
|
IP1 |
ER waiting time |
|
IP2 |
Readmission for same diagnosis within 48 h |
|
IP3 |
Waiting time from ER to bed (admission) |
|
IP4 |
% of total admissions transferred out to another hospital |
|
IP5 |
Wrong site surgery |
|
IP6 |
Foreign body left in during procedure |
|
IP7 |
Inpatient mortality rate |
|
IP8 |
Maternal mortality rate |
|
IP9 |
Infant mortality rate |
|
IP10 |
Discharge Against Medical Advice (DAMA) |
|
IP11 |
Bed Occupancy Rate |
|
IP12 |
Leave Against Medical Advice (LAMA) |
|
IP13 |
Conversion Rate |
|
IP14 |
Cancelled operations |
|
IP15 |
Sentinel event rate |
|
IP16 |
Legal complaints against the hospital |
|
IP17 |
Daily staffing vs occupancy |
|
IP18 |
Resource utilization ($ value of outputs/net operating costs) |
|
IP19 |
Performance against contract ($ value of outputs/$ value of contract) |
|
IP20 |
Surplus inventory (% of current assets) |
|
L |
Learning & Growth Indicators |
|
L1 |
Training hours per employee |
|
L2 |
Employee Absenteeism |
|
L3 |
Staff turnover rate |
|
L4 |
Rate of employee-sick-leave |
|
L5 |
Training expenditures per capita |
|
E |
Economic Indicators |
|
E1 |
Interest rates |
|
E2 |
Gross Value Added (GVA) |
|
E3 |
Net Value Added (NVA) |
|
E4 |
Income and Wage Growth/Decline |
|
E5 |
Tax rates |
|
S |
Social Indicators |
|
S1 |
No. of Fatalities |
|
S2 |
Number of Community Engagement Activities/year |
|
EV |
Environmental Indicators |
|
EV1 |
Carbon Emission (%) |
|
EV2 |
Energy and water conservation % |
|
EV3 |
Waste by unit produced (%) |
|
EV4 |
% of energy in kwh from renewable energy sources |
Source: Created by the author
Additionally, the model can be characterized as a graphical representation in which the vertical axis (Y-axis) represents the values of (C-R), while the horizontal axis (X-axis) represents the values of (C+R). The utilization of the coordinate technique facilitates the determination of the respective relations and positioning of each factor in relation to a point on the coordinates, specifically denoted as (C + R, C-R). Figure 2 demonstrates the significant relations of SBSC perspectives, and Figure 3 illustrates the significant relations of indicators.

The present study utilizes (C-R) values to signify the extent of influence of SBSC dimensions and indicators. The causal variable in this study includes the Finance, Governance, Customer/Patient, and Internal Business Process perspectives, as depicted in Figures 2 & 3, and summarized in Appendix 5. Conversely, the Learning and Growth, Economic, Social, and Environmental perspectives are considered an effect. Moreover, with regards to the individual indicators, all Financial (F1-F4), Governance (G1-G3), and Customer/Patient (P1-P6) are deemed to be causal variables, while all Economic (E1-E5), Learning and Growth (L1-L5), Social (S1 & S2) and Environmental (EV1-EV4) are regarded as an effect. However, some Internal Business Process KPIs are causal (IP2, IP3, IP5, IP7, IP8, IP9, IP10, IP11, IP12, IP13, IP14, IP15, IP16 and IP18) and others (IP1, IP4, IP6, IP13, IP14, IP17, IP19 and IP20) are effect.
In terms of the degree of importance, Figures 2 & 3, and Appendix 5 indicate the ranking of “C+R” values of the eight SBSC dimensions which (in descending order) are Governance (4.17), Financial (3.73), Customer/Patient (3.34), Learning and Growth (2.45), Social (2.29), Internal Business Process (2.24), Economic (1.91), and Environmental (1.75). The highest fifteen crucial indicators with the highest “C+R” values are G2: Annual Reports of Control Activities (4.01), G1: Annual Reports of financial Activities (3.52), G3: Cash value of fines and the total number of non -monetary penalties for non-compliance with laws and regulations (3.41), F1: Return on Investment (3.18), P5: Percentage of revenue form repeat business (3.13) P6: Net Promoter Score (3.11), P2: Patient Complaints/Incidence Rate (3.09), F4: Market Share (3.05), F3: Net Operating Profit After Tax (2.98), P3:Patient Retention Rate (2.88), F2: Net Operating Margin (2.86), P1: Patient satisfaction Rate (2.85), P4: New Customer Acquisition (2.83), L5: Training expenditures per capita (2.49) and IP16: Legal complaint against the hospital (2.43).
The order of “C-R” values of the eight SBSC dimensions are Finance (0.79), Customer (0.25), Internal process (0.12), Governance (0.12), Social (-0.03), Environmental (-0.17), Economic (-0.39) and Learning (-0.70).
The top ten measures with the highest “C-R” values are F1: Return on Investment (0.96), F4: Market Share (0.91), F3: Net Operating Profit After Tax (0.74), P6: Net Promoter Score (0.72), IP16: Legal complaint against the hospital (0.70), F2: Net Operating Margin (0.64), P5: Percentage of revenue from repeat business (0.61), P2: Patient Complaints/Incidence Rate (0.57), IP10: Discharge against medical advice (0.41) and IP18: Resource utilization (0.39).
The main ten KPIs with the lowest “C-R” values are L4: Rate of employee-sick-leave (-1.21), L2: Employee Absenteeism (-1.16), L3: Staff turnover rate (-1.15), L1: Training hours per employee (-1.14), L5: Training expenditures per capita (-1.05), IP17: Daily staffing vs occupancy (-1.05), IP19: Performance against (-0.44), IP20: Surplus inventory (-0.43), EV2: Energy and water conservation (-0.35) and EV4: percentage of energy in kwh from renewable energy sources (-0.33).
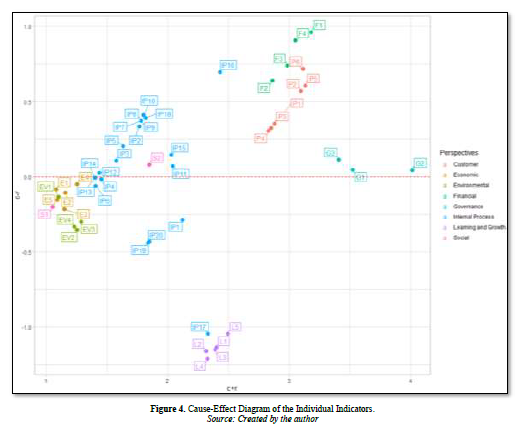
Appendix 7 can also determine the main roles, leading cause dimensions, and central effect dimensions for each of the eight SBSC dimensions. For instance, for the financial dimension, F1 has the principal position and the key effect factor and also the main causal factor. Concerning Governance indicator, G2 is the main effect factor for the governance dimension whereas G3 has the main cause factor. In addition, P5 and P6 play as the main effect and cause factors, respectively in the customer/patient dimension. Furthermore, in the internal business process dimension IP16 considered both the main effect and cause factors. Concerning the sustainable indicators, all indicators in learning and growth has nearly same effect (L2 is a bit lower) whereas for the economic and environmental indicators, E4 and EV3 respectively are the main effect in their dimensions and none of those three dimensions has a cause indicator. In the social dimension, S2 is a main effect and also cause indicator (Figure 4).
A Strategy Map of the SBSC for Private Hospitals in Egypt
The process of establishing appropriate threshold values to indicate significant and substantial connections between the dimensions and sub-elements of the SBSC is a critical aspect of strategy map construction [107]. Threshold values possess the ability to eliminate insignificant associations that emerge from the results of DEMATEL analysis. Directing attention towards the previously mentioned interconnections, the utilization of a threshold value could effectively eliminate insignificant connections while simultaneously guaranteeing that the overall structure of the SBSC remains feasible [95]. Consistent with previous research conducted by Naqi and Lento [108] and Wu [109], the threshold values for the correlations among the eight dimensions of SBSC and 49 KPIs have been determined to be at an average level. Consequently, the thresholds for the SBSC dimensions and indicators are established at 0.1709 and 0.02123, respectively.
Firstly, a strategy map of SBSC perspectives was constructed (Figure 3) based on the matrix (T) in Appendix 4d and the outcomes of (C + R) and (C - R) presented in Appendix 5. As illustrated in Figure 3, the Financial dimension is the leading cause dimension for hospitals in Egypt, as it has the most substantial influence on the other 7 SBSC dimensions. In contrast, the Learning and Growth dimension is the primary influence as it is affected more by the four traditional SBSC dimensions.
Moreover, the strategy map of SBSC perspectives showed that the Governance perspective has the most two-way interdependence with all other seven perspectives whereas the Financial Perspective has only four two-way interdependences with (Governance, Environmental, Customer and Social) and finally, Customer and Social perspectives have two-way interdependence with each other.
Concerning one-way effect, Financial can affect three perspectives (Internal process, Learning and Growth, as well as Economic) while Customer can affect only two perspectives (Internal Business Process and Learning & Growth) and finally Internal process can affect only one perspective (Learning & growth). It deserves noting that, none of the Learning & Growth, Social, Economic and Environmental indicators affect or got effected by each other. Appendix 7 Outlines the numbers of dispatching and receiving factors (Figure 5).

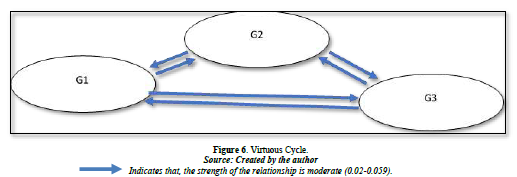
The core indicators in Figure 6 are determined using data from Appendix 6. A critical factor to consider when defining core indicators is establishing a minimum threshold for dispatching and receiving impact. According to Wu [109] and Naqi and Lento [107], a significant metric is defined as a parameter that both disseminates and receives influence from at least 15 other elements. In contrast, Al-Mawali [108] posits that core indicators serve as a metric that both influences and is influenced by at least 12 indicators, which constitutes half of the total indicators utilized in the current study. The present study will examine indicators as a means of measurement that both transmit and receive impact from half of the total indicators utilized, amounting to over 24 indicators. Which lead to three substantial core indicators: G1: Annual Reports of financial Activities, G2: Annual Reports of Control Activities, G3: Cash value of fines and the total number of non -monetary penalties for non -compliance with laws and regulations. Figure 6 shows the relationship among these core indicators.
DISCUSSION, RECOMMENDATIONS AND MANAGERIAL IMPLICATIONS
Sustainable Balanced Scorecard (SBSC) Model
The objective of this research is to offer a framework that integrates sustainability principles to aid healthcare organizations in addressing the obstacles related to social, economic, governance, and environmental inclusion that impede the provision of sustainable healthcare services, particularly in developing nations such as Egypt. Moreover, the objective of this study is to put forward a model for Sustainable Balanced Scorecard (SBSC) that includes essential metrics for enhanced monitoring, evaluation, and management of hospital performance. The model also elucidates the causal relationships between long-term resources and capabilities, encompassing sustainability concerns, and short-term financial outcomes. The proposed model can aid hospital leaders in comprehending the interconnections between various factors and in making informed decisions.
DEMATEL-BASED STRUCTURAL MODELLING FOR PRIVATE HOSPITALS
Cause and Effect Relationships
Using the Decision-Making Trial and Evaluation Laboratory (DEMATEL) method, this study investigated the connections between the various SBSC perspectives and the various important indicators. The perspective of finance (F) that exhibited the highest value of C-R demonstrated the most significant influence on the remaining indicators and was therefore deemed the primary "causal factor" among the perspectives. Subsequently, the customer/patient perspective was ranked second, followed by internal business processes and governance, respectively. The primary objective of private hospitals is to achieve financial gains. To attain this objective, private hospitals must attract a larger customer base seeking superior healthcare services delivered through efficient internal business processes. To ensure the long-term viability of private hospitals, corporate governance serves as a comprehensive framework.
Conversely, the Learning and Growth perspective (L), which exhibited the lowest C-R value, demonstrated the most significant influence from the other indicators and was consequently identified as the primary "effect factor" among the various perspectives. Consequently, the absence of adequate evaluation of the return on investment and the value added, in light of the genuine requirements of patients and comprehension of the primary operations of the hospital, may result in unsustainable performance for private healthcare facilities.
The findings of this study indicate that the finance perspective holds significant influence over the other perspectives of the sampled hospitals' sustainable balanced scorecard (SBSC). Additionally, the Governance (G) perspective, which exhibited the highest value of C+R, demonstrated the strongest correlation with the other indicators and played a pivotal role in shaping the SBSC perspectives of the sampled private hospitals. The findings of this study bear resemblance to those of Chang [1] investigation into the identification of crucial factors pertaining to indicators of sustainable healthcare institutions in Taiwan. The implementation of corporate governance has the potential to improve the environmental, social, and economic welfare through various initiatives [110].
According to DEMATEL results, within the Learning and Growth (L) perspective, the central roles among other indicators are L4: Rate of Employee Sick Leave and L2: Employee Absenteeism. The finding reveals that the rate of employee sick leave, is a paramount lagging indicator employed to evaluate private hospitals’ performance. This is due to its significant impact as the primary "effect-factor" influenced by 37 distinct indicators. According to the strategy map, L4: Rate of employee-sick-leave, L2: Employee Absenteeism and L3: Staff turnover rate are all affected by many other indicators, particularly, P1: Patient satisfaction rate, P2: Patient complaints, P3: Patient retention rate and F1: Return on Investment (ROI).
The indicator with the highest value of C-R, Return on Investment (ROI), exerted the most significant influence on the remaining indicators and was identified as the primary causal factor among them. Moreover, the findings indicate that the proportion of revenue derived from repeat corporate business, the Net Promoter Score (NPS), and resource utilization are significant factors affecting the return on investment (ROI) for private hospitals. These results suggest that enhancing a hospital's reputation and market positioning through cultivating positive relationships with diverse customer segments, as well as optimizing resource utilization, may lead to increased ROI.
In the Customer/Patient perspective (P), P5: Revenue from repeat businesses (corporate business, main effect factor in this perspective), P6: Net Promoter Score (NPS) (main cause factor in this perspective) and P2: Patient Complaints rate are the most central crucial indicators. Furthermore, as per the strategy map, in order to augment the proportion of revenue generated from recurring business, three internal business process indicators have been recognized as having an impact, specifically IP10: Discharge Against Medical Advice (DAMA), IP: 15 Sentinel event rates, and IP16: Legal complaints against the hospital. Furthermore, as per the strategy map, in order to augment the proportion of revenue generated from recurring business, three internal business process indicators have been recognized as having an impact, specifically IP10: Discharge Against Medical Advice (DAMA), IP: 15 Sentinel event rates, and IP16: Legal complaints against the hospital.
In the Internal Business Process Perspective (IP), the strategy map results show that IP16: Legal complaints against the hospital, IP17: Daily staffing vs occupancy, IP1: ER waiting time, IP11: Bed occupancy rate and IP15: Sentinel event rate are the top crucial central indicators of private hospital’s performance. The duration of waiting time in emergency rooms is a significant concern that impacts numerous hospitals, leading to patient dissatisfaction. In 2008, a study conducted by researchers in Ontario revealed that prolonged waiting times not only affect patient satisfaction, but also elevate the likelihood of mortality and hospital readmission for patients who have been discharged from the emergency department [111].
The present study reveals that IP1: prolonged waiting times in the emergency room have a significant impact on the turnover rate of staff, frequency of employee sick leave, and availability of training opportunities. These findings suggest that extended waiting periods not only impose physical strain and burnout on staff, but also deprive them of the time required for professional development and training, ultimately leading to elevated rates of turnover and sick leave.
The Prioritization of the Critical Indicators
The study results indicate that the top ten priorities of indicators for the private hospitals are F1: Return on Investment (ROI), F4: Market Share, F3: Net Operating Profit After TAX (NOPAT), P6: Net Promoter Score (NPS), IP16: Legal complaints against the hospital, F2: Net Operating Margin, P5: % of Revenue from repeat business, P2: Patient Complaints/Incidence Rate (%), IP10: Discharge Against Medical Advice (DAMA) and IP18: Resource utilization ($ value of outputs/net operating costs). These ten indicators are deemed to be the most crucial causal factors in the developed strategy map. With regards to the strategy map, it can be observed that F4: Market Share, exerts an impact on P1: Patient Satisfaction Rate, P3: Patient Retention Rate, and P5: Percentage of Revenue derived from Repeat Business. The findings presented here are consistent with those reported by Wu [2011]. However, it should be noted that while Wu's study identified Market Share as the primary causal factor, this study identifies Return on Investment (ROI) as the most significant factor, with Market Share ranking second in importance.
RECOMMENDATIONS AND MANAGERIAL IMPLICATION
The findings of the study address a previously identified obstacle in the literature regarding the execution of Sustainable Balanced Scorecard (SBSC) frameworks by decision-makers [112]. This obstacle pertains to the qualitative nature of sustainability parameters, which contrasts with the typically quantitative nature of the four traditional perspectives of the Balanced Scorecard (BSC). Consequently, the study developed a SBSC model by identifying a total of 49 performance indicators for private hospitals in Egypt. The adoption of this approach is expected to yield a decrease in the amount of effort and learning curve that private hospital leaders need to undergo in identifying a suitable sustainable performance measurement framework for their respective institutions.
Additionally, DEMATEL method was employed to establish a strategy map by analyzing the causal interrelationships and influence’s strengths among the SBSC indicators, based on the synthesized opinions of hospital leaders. The prioritization results suggest a viable approach for hospital administrators to optimize resource allocation towards areas that require the most improvement. The study results indicate some managerial implications as follows:
First, the DEMATEL method can offer practical guidance for prioritizing strategic initiatives of private hospitals, as the causal relationships between all indicators are logically revealed through the systematically-constructed strategy map. Particularly, in situations where there are limitations in terms of time, finances, infrastructure, and human resources, it would be beneficial for managers to prioritize key indicators that hold greater influence over the others. For example, the developed strategy map includes several leading indicators, which are performance drivers that have a specific influence on the one lagging indicator, namely the "Rate of employee-sick-leave." This outcome measure is considered a main effect-factor with a relatively lower priority. These findings suggest that as enhancement of governance control, financial performance, and patient satisfaction enhance, rate of employee sick leave decreases. Consequently, private hospitals can consider the rate of employee sick leave as a significant lagging indicator, which serves as an outcome measure for performance measurement by management.
Second, it is recommended that hospital managers prioritize the examination of interdependencies among indicators, as such interdependencies may result in positive reinforcement among indicators.
Third, the study results indicate that the evaluation of private hospitals' performance is contingent upon several key indicators, including "Governance Control Activities," "Governance Financial Activities," "Non-compliance with laws and regulations," "Return on Investment," "% of Revenue from repeat business," "Net Promoter Score (NPS)," and "Patient Complaints/Incidence Rate". The initial three crucial indicators pertain to the governance perspective of the SBSC, whereas the final three crucial indicators pertain to the customer/patient perspective, with only one indicator (ROI) pertaining to the financial perspective.
Thus, it can be inferred that private hospitals may find it more advantageous to prioritize sustainability and non-financial measures, specifically those within the governance and customer/patient perspectives, as primary outcome measures, rather than relying solely on the financial measures commonly utilized in traditional Balanced Scorecard implementations, as depicted in the top (financial perspective) of the fundamental strategy map template introduced by Kaplan and Norton [113]. Private hospitals should establish strategic objectives based on governance and customer-orientation.
RESEARCH LIMITATION AND OPPORTUNITIES FOR FUTURE RESEARCH
This research is susceptible to the typical constraints of survey-based inquiry, which include: The DEMATEL questionnaire survey, similar to other expert questionnaires, is subject to limitations in responses due to the subjective nature of decision-making that is inherent in human consciousness. Secondly, the formation of an expert panel is bound to lead to selection bias. Thirdly, it is important to note that the subjective evaluations of various experts regarding the distinct SBSC perspectives may exhibit variations. It is possible that the critical indicators chosen by private hospitals for the SBSC may not be applicable to other sectors or institutions.
The degree of cooperation between private hospitals and external researchers is restricted, which limits access to certain information, including performance targets, strategic initiatives, and action plans of private hospitals. Thus, this study focused solely on two elements, namely performance indicators and their significance, within various sectors and institutions. In order to enhance its utility for SBSC developers in the healthcare sector, future research endeavors may extend their scope to encompass additional SBSC components, such as targets and initiatives. Furthermore, further investigation is necessary to determine the feasibility of implementing the proposed SBSC model in various countries and contexts, including both public and private healthcare facilities.

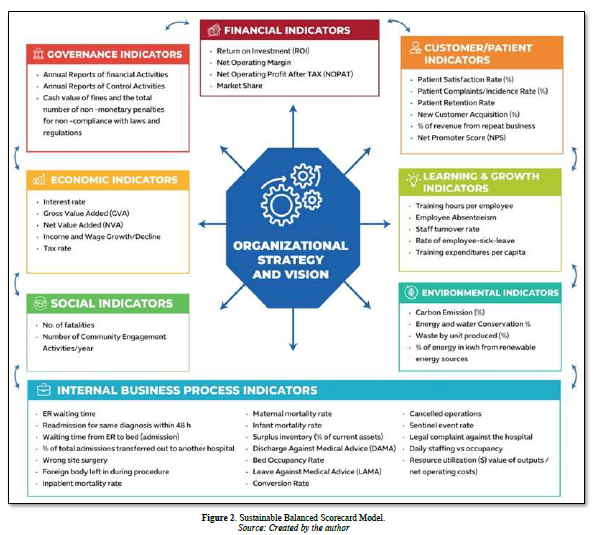
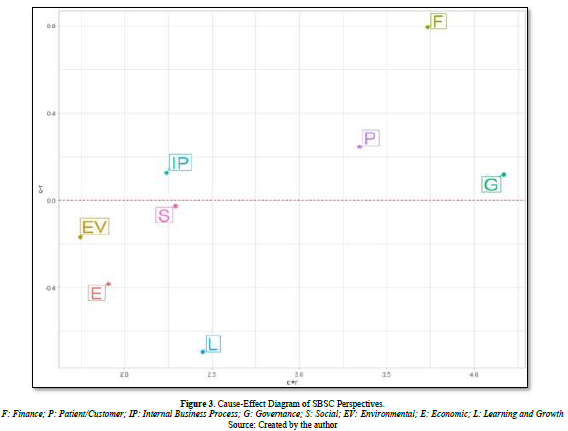

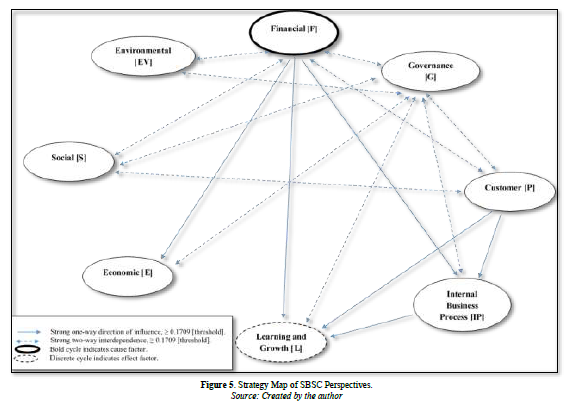
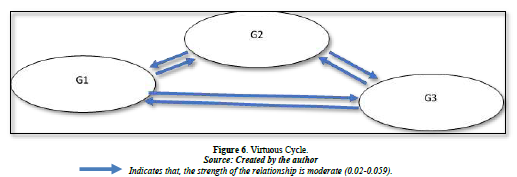
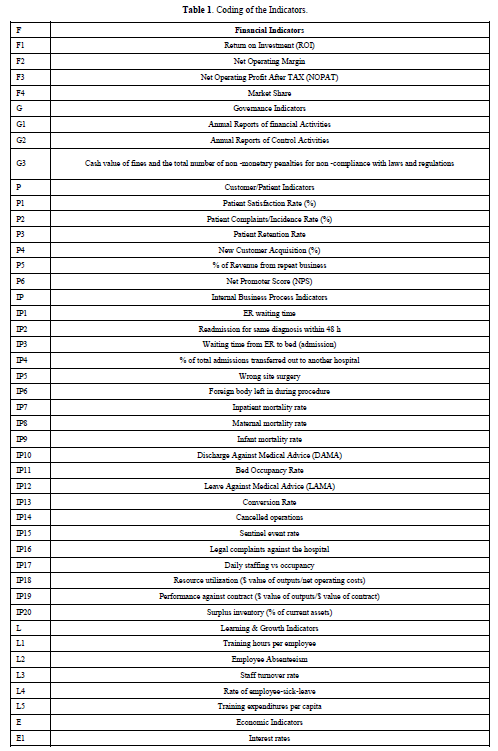

No Files Found


Internationally Accepted
Share Your Publication :