
-
Publish Your Research/Review Articles in our High Quality Journal for just USD $99*+Taxes( *T&C Apply)
Offer Ends On
Publish Your Research/Review Articles in our High Quality Journal for just USD $99*+Taxes( *T&C Apply)
Offer Ends On
Olaf Stotz*
Corresponding Author: Olaf Stotz, Finance Department, Frankfurt School of Finance & Management, Frankfurt, Germany.
Received: December 07, 2023 ; Revised: January 20, 2024 ; Accepted: January 23, 2024 ; Available Online: February 01, 2024
Citation:
Copyrights:
Views & Citations
Likes & Shares
We analyze the relation between financial literacy and financial well-being in the pension domain. Using survey answers, we find that individuals with a high level of financial literacy display a pension satisfaction level that is more than 0.3 higher (on a scale ranging from 1 to 5) than that of individuals with a low level. We give this difference a causal interpretation by using an instrumental variables approach, a matched estimation approach and various robustness checks. We conclude that financial literacy is an important channel to improve individuals’ satisfaction in the retirement domain.
Keywords: Financial literacy, Financial well-being, Pension satisfaction
INTRODUCTION
It is well known that financial knowledge is rather low among many individual investors [1,2]. The lack of financial literacy has been recognized by political decision makers, and, as a result, many education programs have been implemented that aim at increasing financial literacy [3]. These programs are regularly evaluated by how they influence an individual’s savings and investment decisions. Observed decisions are thus compared with ‘optimal’ decisions that are often derived from a life-cycle model (dating back to Ando and Modigliani [4]). We refer to this neoclassical channel as the financial perspective of financial literacy.
Such a financial channel might be too limited to analyze the impact of financial literacy, according to a Consumer Financial Protection Bureau report [15]. CFPB claims that ‘consumers can experience financial well-being - or a lack of it - regardless of income. It’s a highly personal state, not fully described by objective financial measures’ [6,7]. Accordingly, CFPB suggests that the increase of financial well-being should be the final goal of any effort to increase financial literacy. We refer to this impact as the satisfaction channel (in contrast to the financial channel, in which income, consumption and savings decisions are the main drivers of utility).
Recent research has investigated the connection between education and overall life satisfaction. For instance, Ilies [8] discovered that education across various domains (health, employment, wealth) contributes to a heightened level of overall life satisfaction. Examining the financial dimension, Xiao and Porto [9] conducted an empirical study utilizing the 2012 National Financial Capability Study in the US, revealing that education enhances financial well-being through financial literacy. They observed that subjective assessments of literacy are strongly correlated with well-being, whereas objective literacy has a comparatively smaller impact. Hwang and Park [10], in a meta-analysis based on fourteen peer-reviewed articles, supported this notion by affirming that financial knowledge significantly drives financial well-being. Similarly, a comprehensive meta-study conducted by Nanda and Banerjee [11], encompassing 128 articles, arrived at analogous conclusions, providing broad support for the satisfaction channel evident in the literature.
This paper delves into an integral aspect of financial well-being: pension satisfaction. The global pension landscape has undergone substantial transformations over recent decades. Individuals now bear more responsibility for their retirement income due to reductions in old-age social security, complemented by employer-organized pension plans and private avenues to optimize savings, investments, and decumulation decisions. This shift has become more important because of aging populations in numerous countries and the wide range of individual pension choices. Despite this, the analysis of the satisfaction channel within the pension domain has been largely overlooked in existing literature. This paper attempts to address this gap.
In particular, our research goal is to analyze if and how much a higher level of financial literacy is related to how an individual self-assesses her well-being in the pension domain. Our results suggest that people with a high level of financial literacy tend to be more satisfied with their retirement finances than less literate people are. Financially high-literate people tend to report a satisfaction score of about 0.3 higher than that reported by financially low-literate individuals (on a satisfaction scale ranging from 1 to 5). This observation also holds if we control for an individual’s financial channel (absolute and relative income), age, gender and additional control variables. Using an instrumental variable approach and a matched estimator, we additionally provide support for the idea that this difference is causally driven by financial literacy. Various robustness checks also show that the relation between financial literacy and pension satisfaction is not sensitive to various specifications and methodological approaches. We therefore conclude that one key to improving an individual’s satisfaction with her retirement situation is to increase her financial knowledge.
In the next section we describe how we measure pension satisfaction and present the econometric approach of how financial literacy may potentially impact pension satisfaction. We then present and discuss our empirical results, while also providing some robustness checks. Lastly, the final section concludes this article.
FINANCIAL LITERACY AND PENSION SATISFACTION
Empirical model of pension utility
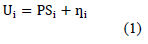
What determines an individual’s pension utility? We analyze this question empirically by asking individuals about their satisfaction with their financial pension situation (PS = pension satisfaction). To be specific, we ask people, via a survey, to evaluate their PS on a Likert scale ranging from 1 (worst) to 5 (best). We follow the approach widely applied in the subjective wellbeing literature by assuming that an individual i derives her pension utility U by setting this utility to the PS score plus an error term:
Kahneman and Krueger [12] show that this approach to measuring utility seems to be valid, since subjective measures of satisfaction are well correlated with objective measures of utility. PS scores are measured on an ordinal scale. However, Ferrer-i-Carbonell and Frijters [13] show that subjective satisfaction measures can also be treated as cardinal, as long as fixed effects are considered. We consider fixed effects by asking individuals to evaluate their satisfaction with the general financial pension situation in Germany (PSgen). Including general pension satisfaction thereby considers that individual-specific optimism or pessimism should not drive our results, while in the empirical section, we obtain similar results for treating pension satisfaction as ordinal or cardinal.
Econometric approach
Our primary interest is in how financial literacy is related to pension satisfaction. We therefore relate pension satisfaction to financial literacy ( ), general pension satisfaction and various control variables:
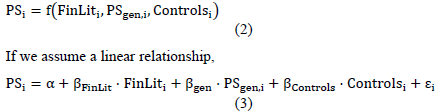
a positive coefficient would be compatible with the hypothesis that knowledge supports satisfaction. This leads to our main research hypothesis:
Research Hypothesis: A higher level of financial literacy is associated with a higher level of pension satisfaction ).
Previous literature finds that knowledge in general has a positive impact on the degree of control over one’s life [14] and therefore supports a high level of satisfaction with various life domains. We measure financial literacy by asking individuals to self-assess their financial knowledge (on a scale from 1, indicating very low financial knowledge, to 5, indicating very high financial knowledge). Self-assessed financial literacy is sometimes used as a measure of actual financial knowledge, and indeed it is often correlated with objective measures [15]. We additionally check this with the three knowledge questions of Lusardi and Mitchell [16] to obtain a measure of objective financial knowledge. Those individuals who assessed their level of financial knowledge as high or very high answered the three knowledge questions correctly. Our sample thus displays a positive correlation between self-reported measures and objective measures of financial literacy.
We estimate equation (3) with ordinary least squares (OLS) by assuming that pension satisfaction is cardinal, but we also estimate equation (3) by ordered probit, considering that pension satisfaction is ordinal. We obtain similar results for both estimation approaches. In both cases, however, the interpretation of the parameter faces the problem of self-selection, that is, individuals self-select into high and low levels of financial knowledge, since the level of literacy has not been selected randomly. This selection problem may introduce a bias into the estimate of parameter if people who decided to become financially literate were also inclined to be more satisfied anyway. Angrist and Pischke [17] suggest various approaches to addressing a potential selection bias. We follow two approaches: a matching procedure, and an instrumental variable approach. These approaches reduce the self-selection bias and allow us to give parameter a causal interpretation (i.e. knowledge causes satisfaction) in addition. We discuss the two approaches in the next subsections.
Matching estimator
Since individuals self-select into high and low levels of literacy, we cannot observe what level of pension utility an individual will perceive if she selects the opposite level of financial literacy. This unobserved level of pension satisfaction could then be compared with the observed one, and the difference provides an unbiased (and causal) effect of literacy on pension satisfaction. To estimate the unobserved difference Angrist and Pischke [17] propose the following matching estimator (which is an alternative to estimating ):
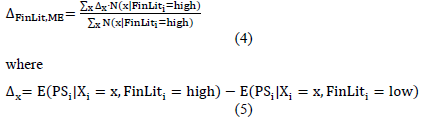
The matching estimator thus produces an overall average treatment effect by weighting conditional on control variables (denoted by X, e.g. X = optimism).
Instrumental variables estimator
As a second approach to give a causal interpretation and to reduce concerns of a selection bias, we also estimate our model by using an instrumental variable (IV) approach. A main challenge is to find an appropriate instrument for financial literacy [2]. To be a valid candidate, the instrument should be related to knowledge but have no partial relationship with PS except through financial literacy. An instrument should then exploit exogenous variation in financial literacy. One instrument for financial literacy has been put forward by van Rooij [18]. They use the financial knowledge of siblings and parents as an instrument for an individual’s financial literacy when the causal relationship between literacy and financial behavior is analyzed. Because our sample does not provide the financial expertise of close relatives, we therefore cannot apply this approach.
Alternatively, we exploit the relation between an investor’s financial knowledge and her risk preferences. Why should risk preference be an appropriate instrument for financial literacy? First, previous research has shown that financial knowledge and risk aversion are negatively correlated. For example, Hibbert [19] have shown that Finance professors (high level of financial knowledge) tend to invest in a riskier manner than do English professors (lower level of financial knowledge). Second, consider, for example, a person who is risk averse. Her risk aversion tends to make her investment decisions focus on assets with a low level of risk (e.g. investing in riskless assets such as government bonds). As a consequence, there is no incentive to acquire knowledge on risky investments (e.g. stocks), since she would never invest in a risky asset. In this instance, the acquisition of knowledge on a risky asset class would be both useless and costly to acquire. A rational investor would tend not to invest in this knowledge. Risk averse investors therefore tend to have a lower level of financial literacy. Third, there is an additional argument as to why risk aversion is an appropriate instrument for financial literacy. A prerequisite for acquiring knowledge in general and financial literacy in particular is a high level of cognitive ability. Empirically, Dohmen [20] provide extensive evidence that cognitive ability and risk aversion are negatively correlated - that is, individuals with a high cognitive ability tend to be less risk averse.
Specifically, we follow Rivers and Vuong [21] and estimate a 2SLS (two stage least squares). The first stage regression,

is estimated by OLS. RA is a dummy variable that equals one if a person’s self-evaluation of risk aversion is above average (zero otherwise). Fitted financial literacy, denoted by , then replaces in equation (2):

Control variables
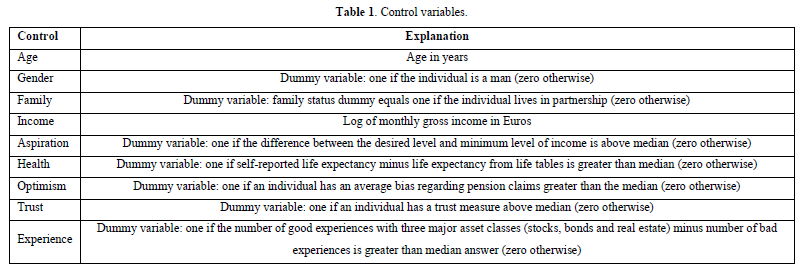
We consider various control variables that are potentially related to pension satisfaction (see Table 1 for a summary and definition). To begin, our controls consider key demographic characteristics such as gender, family status and age. Various studies have shown that these demographics are related to life satisfaction in general [13,22,23]. Second, a further natural control is income, since higher income tends to increase pension entitlements. With respect to income, Clark [24] provide a detailed overview of its relationship to life satisfaction in general. It should be noted that income primarily characterizes the financial perspective. Third, economists find that happiness decreases with aspiration levels, as people with higher aspirations tend to report lower satisfaction scores [25]. In order to obtain a proxy for aspiration levels, we ask individuals about two levels of retirement income: a minimum level, and a desired level. A larger difference between the desired level and minimum level of income is then transformed into a dummy variable (one if the difference is above median, zero otherwise). Fourth, an individual’s health status seems to be an important determinant of subjective wellbeing [26]. We measure health status by asking survey participants about their life expectancy (in years) and compare this with life expectancy from life tables. According to Hamermesh [27] and Hurd and McGarry [28], a higher life expectancy is a good proxy for an individual’s health condition. Next, we include a measure of optimism as a control variable, since Brunnermeier and Parker [29] argue that agents have a higher current utility if they are optimistic about the future. We measure optimism by comparing self-assessed pension claims with reported pension claims in the governmental, occupational and private pillars. We standardize each bias by its pillar-specific, cross-sectional standard deviation (across individuals) to account for the varying degree of difficulty of estimating pension claims across pillars. We then take the average for each individual across the three standardized biases and construct a dummy variable, which is one if an individual has an average bias greater than the median and zero otherwise. We also consider trust to be a potential determinant of pension satisfaction, since there is evidence that trust in the financial system and financial intermediaries increases the probability of holding risky assets and pension plans [30,31]. We derive a measure of trust by asking about their level of trust (high or low) in investments in three major asset classes: stocks, bonds and real estate. We count all ‘high trust’ answers and create a trust dummy that equals one if an individual has a count above median, and zero otherwise. Our final control is experience with past investments, in order to consider a potential difference between expected utility and experienced utility [32]. We derive a measure of experience by asking survey participants about their experience with three major asset classes: stocks, bonds and real estate. We count all answers of ‘good experience’ and subtract the number of answers of ‘bad experience’.

EMPIRICAL RESULTS
Data and descriptive statistics
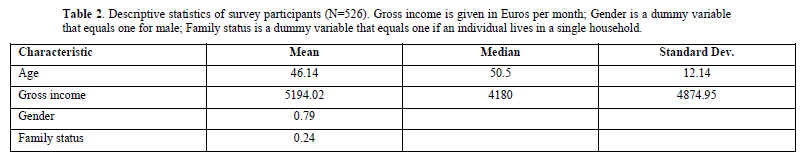
We perform an experiment in collaboration with two leading newspapers in the German press. One outlet is Handelsblatt, a leading daily business newspaper, while the second outlet is Frankfurter Allgemeine Zeitung (FAZ), a leading general daily newspaper. Each newspaper published an article about pension issues and linked to a questionnaire. Even though there was no incentive to answer the questionnaire, 526 individuals voluntarily participated. Table 1 summarizes some descriptive statistics. Survey participants are, on average, 46 years old, which is slightly older than the average German (i.e. 45 years old). The average monthly income equals about 5.200 Euros, an amount larger than the average income in Germany (3.975 Euros). Seventy-nine percent of participants are male, and 24% of all participants live in a single household. The proportion of single households in Germany is about 42%. Thus, we cannot claim that the sample is a perfect representation of the German population, since it is slightly older, has a higher income, is predominately male and lives less often in single households. Nevertheless, the sample should be informative about the relation between financial knowledge and pension satisfaction (Table 2).

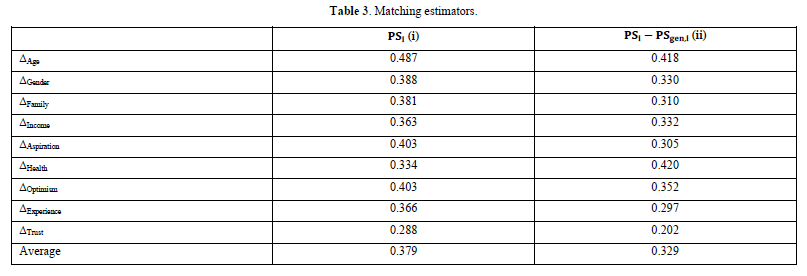
In our sample, we find that average pension satisfaction ( )) is 3.870 for knowledgeable and 3.488 for less knowledgeable individuals, with a difference of 0.382. The average relative pension satisfaction ( ) is 0.482 for knowledgeable people and 0.163 for those less knowledgeable (difference = 0.318). Therefore, the more than 0.3 satisfaction points is a first indication that financial knowledge has a positive relation to pension satisfaction. However, this simple difference may be biased if individuals self-select into the level of financial knowledge and if knowledgeable people tend to be satisfied anyway. We therefore also present a matching estimator in Table 3 for each control variable (see Equation (5)) and the average matching estimator (see Equation (4)).

The average matching estimator supports a causal interpretation of the positive link between literacy and pension satisfaction. A knowledgeable individual evaluates his or her retirement situation by about 0.379 points higher than a less knowledgeable one (see Column (i)). The relative pension satisfaction is 0.329 points higher for individuals with a financial literacy above median compared to those with a financial literacy below median (see column (ii)). If we look at the conditional difference (i.e. conditional on various controls) we find similar results. The differences vary between 0.288 (conditional on trust) and 0.487 (conditional on age) if we consider , and between 0.202 (conditional on trust) and 0.420 (conditional on health) if we consider .
Regression results
A robust test of the relationship between satisfaction with individual retirement situation and financial literacy should control for fixed effects (some individuals tend to have higher levels of satisfaction), socio-economic and demographic variables (which are important in determining general satisfaction with life), other controls (that may affect ) and potential selection effects (to give coefficient estimates a causal interpretation). We therefore compare various (hierarchical) regression models that subsequently add those variables in the regression:

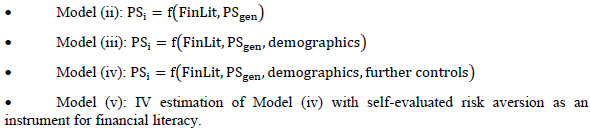
We estimate Models (i) to (v) with two different approaches: ordinary least squares (OLS) and ordered probit, since pension satisfaction in equation (2) is measured on an ordinal scale (ranging from 1 to 5). Ferrer-i-Carbonell and Frijters [13] show that both estimation approaches tend to lead to similar conclusions about the impact of variables. In our case of pension satisfaction, we also find that both approaches - an OLS estimation and an ordered probit estimation - are also quantitatively closely related. We present these approaches in Table 4 (OLS) and Table 5 (ordered probit). When using OLS, we treat true pension satisfaction as a latent variable, that is . Furthermore, we assume that and in equation (3) are uncorrelated.


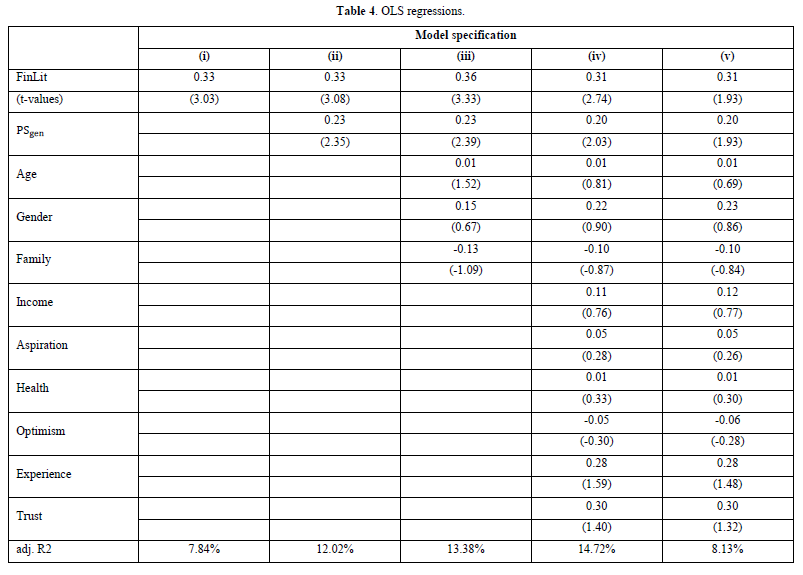
We first focus on Table 4. For survey participants we observe that self-assessed financial knowledge is strongly associated with displaying a higher level of individual pension satisfaction. The coefficient on financial literacy is largely independent of the specified model and is estimated to be between 0.31 and 0.36, with t-values around three. These estimates closely resemble the matching estimator displayed in the descriptive section (0.33 and 0.38). The stable coefficient estimates support the hypothesis that financial literacy plays an important role in determining individual pension satisfaction. The regression models further reveal that including a general pension satisfaction measure is the most important control variable. The coefficient of determination increases from about 8% (model (i)) to about 12% (model (ii)). We have argued that this variable should control for fixed effects - that is, if one individual generally provides higher satisfaction levels (outside of control for the researcher), the coefficient should be larger than zero. The significant coefficient on general pension satisfaction (about 0.2) indicates that it captures (at least partly) fixed effects. However, including as a control variable has no effect on the slope of financial literacy. We obtain similar results (displayed in the robustness section) if we use relative pension satisfaction, , as a dependent variable and thereby consider fixed effects differently.
Looking at the sequential inclusion of various groups of controls shows that the coefficient of determination of the regression (adjusted ) increases from about 8% (Model (i)) to almost 15% (Model (iv)). The general view is that two variables, and , explain about 12% of the cross-individual variation in . Demographic and remaining controls (nine variables), however, add less than 3% to the adjusted R2 of Model (ii). Therefore, none of the coefficients on the nine control variables is estimated significantly different from zero. It is important to note that the coefficient on income is also not significantly greater than zero. This estimate implies that a potential financial channel to pension satisfaction is limited, at least in our sample of survey participants who tend have an income above median. It is also worth highlighting some remaining estimates. If we replace income with a dummy variable of income (1 denotes income above median income in Germany, 0 denotes income below or equal to median in Germany), the estimate coefficient more than doubles to 0.25, with an associated t-value of about 1.83. This observation may point to the empirical observation that the relation between satisfaction and income is nonlinear. The estimates on demographic variables (age, gender, family status) are not significant, though they do display the same signs as in analyses of general subjective wellbeing. In general, although parameters on controls are not significant, they tend to go in the theoretically predicted direction.
To give the parameter a causal interpretation, Model (v) is estimated by a 2SLS regression using risk aversion as an instrument for financial literacy. An appropriate instrument should satisfy the exclusion restriction - that is, there should be no partial effect of the instrument on satisfaction with individual retirement situation (pension utility). Risk aversion is correlated with financial literacy (correlation = 0.367), and there is no correlation between pension utility and the residual of the effect of financial literacy on pension utility, including control variables (correlation = 0.001). In addition, risk aversion is a non-weak instrument, since the first stage of 2SLS delivers an F-statistic of 23.386 > 10. Risk aversion is thus compatible with the requirements of a suitable instrument. The IV approach delivers a parameter estimate for of 0.31, which is similar to from Model (iv). However, the associated t-value is substantially lower compared to Model (iv) (1.93 vs 2.74), while the coefficient is still marginally different from zero. Lower significance levels in IV approaches, in the context of financial literacy, have been previously observed [33]. The IV approach therefore supports the view that financial literacy causes financial satisfaction to be higher.
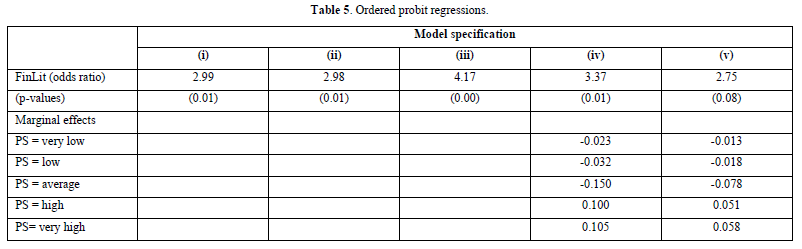
Next, we present ordered probit estimates for Models (i) to (v) in Table 5. In general, the OLS results are largely confirmed. An individual with above-median financial literacy, compared to an individual with below-median financial literacy, is about three times as likely to have a higher pension satisfaction score than a lower one - that is, the odds ratios vary around three (between 2.75 for Model (v) and 4.17 for Model (iii)). The size and significance of the coefficients support the view that a higher level of self-evaluated financial literacy is associated with a higher likelihood of greater pension satisfaction.
Since the magnitude of the odd ratios is not directly interpretable, we also calculate marginal effects. We then obtain a better measure for the effect size of financial literacy (summarized in Table 5). We report marginal effects for both regression specifications, which include all control variables ((iv) in Panel A and (v) in Panel B). Marginal effects are positive in the two highest response categories of pension satisfaction, and negative in the three lowest satisfaction categories. Thus, odds ratios and marginal effects yield a similar conclusion.
Robustness of regression results
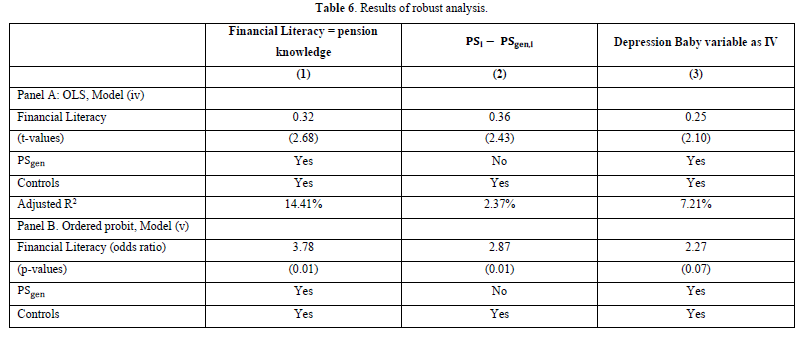
In this section we present alternative specifications of estimating Models (iv) and (v), which include all control variables. We thereby examine whether the baseline results of the estimates of in Tables 4 & 5 are sensitive to the particular choice of how independent variables are measured. First, in Column (1) in Table 6, we introduce pension knowledge as an alternative to measuring financial literacy. Second, in Column (2), we replace the dependent variable pension satisfaction by the difference between pension satisfaction and the satisfaction with the pension system in general. Finally, Column (3) presents estimates of an alternative instrumental variable. We discuss each alternative estimate in the following subsections. However, it is important to note that each alternative lead to a similar conclusion about the relation between pension satisfaction and financial literacy.

Alternatives to measuring financial literacy
In our baseline regression we asked individuals to self-evaluate their financial knowledge in general. We also asked individuals to self-evaluate their pension literacy (instead of general financial literacy). Knowledge about the pension system may be partly different from financial literacy in general. We find in our sample that the average self-evaluated pension knowledge is about 3.03, compared to 3.37 for self-evaluated financial knowledge. We attribute lower pension knowledge to the complex pension system in Germany sample [34]. For example, an investor may be financial literate - e.g. she knows that a portfolio of stocks diversifies risk more efficiently than a single stock - but she may not be familiar with how each pillar in the German pension system is taxed.
In Table 6, Column (1) of Panel A displays the estimates of using OLS, while Panel B shows coefficients of the ordered probit estimation approach. We find that using pension knowledge as an alternative to general financial knowledge does not have much impact on the estimated coefficient . The slope of the OLS regression equals 0.32, which is marginally larger than our base case estimates of 0.31. Furthermore, the t-values and coefficients from the ordered probit approach are similar to the base case. Since both dimensions of knowledge (pension and general financial literacy) display a correlation of about 83%, survey participants with a high self-evaluated knowledge in one dimension also tend to perceive their knowledge in the other dimension as being above average. Therefore, differentiation between financial knowledge and pension knowledge does not change the main conclusion about the relation between pension satisfaction and knowledge.
Alternatives to measuring pension satisfaction
In our baseline regression we included general pension satisfaction as an independent variable in order to capture cross-individual heterogeneity about the pension satisfaction level. In this subsection we consider the difference between individual pension satisfaction and general pension situation ( as a relative satisfaction measure. Using relative pension satisfaction is an alternative approach to considering cross-individual heterogeneity about the pension satisfaction level. Column (2) of Table 6 displays the results of this exercise. We find that the estimate of the slope coefficient increases to 0.36 (from 0.31 in our base case scenario). Relative pension satisfaction is therefore even more strongly related to knowledge than the base case suggests.
Alternative to self-evaluated risk preference as an instrumental variable
The baseline regression has used self-evaluated risk aversion as an instrument for financial literacy. Self-reported risk aversion can be criticized for measuring a ‘clean’ risk aversion parameter in the Arrow-Pratt sense. First, individuals may differently interpret the available options when asked about their financial risk aversion. Second, average risk aversion can have different meanings for different individuals. We therefore use an alternative approach to measuring risk aversion, one suggested by Malmendier and Nagel [35]. They introduce a risk aversion measure called the ‘Depression Baby variable’. Malmendier and Nagel [35] argue that past experience may influence an individual’s attitude towards risk. This proxy for risk aversion is also in the spirit of the model of Cunha [36], who argue that the development of cognitive skills depends on the experienced environment, which ultimately affects the formation of (risk) preferences. In particular, the Depression Baby variable is a weighted average of past asset returns. Recent returns thereby obtain a higher weight than more distant returns. For details, we refer to equation (1) of Malmendier and Nagel [35].
Column (3) shows that using the Depression Baby variable as an alternative instrument for knowledge produces a similar slope. Although the estimated coefficient of 0.25 is somewhat smaller than our base case estimate (0.31), the corresponding estimation errors are also smaller. This results in a t-statistic of 2.10, which is slightly larger than that of the base case (1.93). This is to say that the experienced driven instrument for risk aversions (additional to self-reported) supports the causal role of knowledge in pension satisfaction.
In sum, the analysis in this subsection has shown that the role of knowledge is robust when using alternative approaches of measuring pension satisfaction and financial knowledge. We also used alternative proxies for some controls (e.g. relative income instead of absolute income, not reported) and obtained similarly robust estimates for .
DISCUSSION
The findings of the preceding section indicate the significance of financial literacy as a crucial channel for enhancing pension satisfaction. This observation not only reinforces the consensus in existing literature regarding the positive influence of education and its correlation with cognitive abilities on overall well-being [37] but also introduces a novel dimension concerning pensions to the discourse on the relation between financial literacy and financial well-being [10].
Quantitatively, our results align with prior studies on the substantial impact of financial literacy on financial well-being. Xiao and Porto [9] report a coefficient estimate ( ) of 0.44; however, their measurement of financial satisfaction used a Likert scale ranging from 1 to 7. Adjusting this coefficient to fit our scale of 1 to 5 yields in a of 0.31 (=5÷7·0.44), which closely corresponds to the coefficient estimates found in our study for the pension domain (between 0.31 and 0.36). Notably, Xiao and Porto’s [9] analysis did not endeavor to provide a causal interpretation for the parameter estimate, unlike our study.
We contend that the nexus between 'knowledge supports well-being' within the pension domain bears substantial practical implications. Policymakers ought to place greater emphasis on the link between knowledge and well-being when structuring pension systems. Many pension systems, especially in countries like Germany, are intricately complex, leaving a significant portion of the population feeling ill-equipped to comprehend their functioning. This lack of understanding can detrimentally impact an individual’s well-being. Hence, policymakers should account for the 'knowledge supports well-being' aspect in the design of pension systems.
Typically, the focus of pension system design centers on financial aspects such as pension levels and subsidies for pension savings. However, the outcomes of our study indicate that policymakers should also prioritize educational and informational support to enhance the understanding of these systems among workers and retirees. Only what individuals comprehend can be positively valued by them. Initiatives geared towards education and information dissemination could empower individuals to make informed decisions regarding pension finances. Moreover, these initiatives could serve as an alternative avenue, potentially more cost-effective than financial incentives like tax reliefs or subsidization, to increase pension awareness.
CONCLUSION
What determines an individual’s satisfaction with her financial retirement situation? The results of this study suggest that financial literacy is an important path to obtaining higher levels of pension satisfaction. Financial issues such as income, however, seem to be less relevant. Our quantitative results suggest that people who self-evaluate their financial knowledge above the median tend to display more than 0.3 units of satisfaction (on a range from 1 to 5) compared to individuals with below-median financial literacy. Additionally, financially literate individuals are three times more likely to be in a higher satisfaction category than are individuals with below-median or median knowledge levels. Our econometric approach (including an instrumental variable approach and a matched estimator) thereby intends to give the relationship between knowledge and pension satisfaction a causal interpretation. These results are confirmed by a variety of robustness checks.
The conclusions of this study are of practical importance. Relying on the causal interpretation of the knowledge-satisfaction relationship, financial knowledge is key to achieving pension satisfaction. Consequently, increasing pension knowledge - either by information or education - may finally lead to a higher satisfaction level of savers. As suggested by Fernandes [33], such education programs should rely on a more individualized and ‘just in time’ approach. Besides the satisfaction channel, financial education is also an important factor in the financial channel [2]; for example, higher financial literacy increases pension plan participation [31]. Research also suggests that financial knowledge is key to good retirement decisions, as it is positively linked to higher levels of savings for retirement [38-40]. Less knowledgeable people, however, tend to invest less in their pension pot [41,42]. In addition, a higher level of financial well-being can also have a positive impact on financial behavior as documented by Tahir and Ahmen [43]. They find that improved financial well-being is associated with a lower debt level of Australian households. Thus, financial knowledge seems to be a crucial step in enhancing the retirement situation in both the financial and satisfaction domains. Furthermore, the increase in financial well-being to evaluate education programs may be an additional dimension, as suggested by CFPB.
However, the current study faces some limitations. Although the econometric approach has supported the causal interpretation of the knowledge-satisfaction relationship, alternative approaches such as natural experiments could further analyze the role of knowledge. Additionally, considering a sample size of slightly more than 500 survey participants who, on average, tend to have a higher income than the German average, one should be careful when drawing conclusions about the population as a whole. Therefore, future research should cover a wider range of individuals. Also, the current study has focused on the satisfaction channel and has considered the financial channel only indirectly by using financial controls. However, there may be a tradeoff between financial issues and satisfaction issues in the pension domain. The analysis of such a tradeoff is left for future research. That said, the transformation process of a pension system from a low level of responsibility to a high level is likely to be smoother if individuals are satisfied with their personal retirement situations.

No Files Found


Internationally Accepted
Share Your Publication :